Breeze has built in diagnostics that can help troubleshoot performance issues with cameras or running workflows. Such issues can occur because of too complicated workflows, too slow computer hardware, too slow network, or too large volumes of data.
Factors influencing Runtime performance
-
The size of the hyperspectral data: the number of wavelength bands and the number of pixels. In some cameras binning can be used to reduce spectral or spatial resolution to reduce the size of data.
-
The framerate (speed) of the camera: too fast and too much data can be generated
-
The complexity of the workflow Analysis Tree. Some algorithms, like the machine learning algorithms are CPU intensive.
-
The performance of the PC. Installation and getting started
-
A fast Intel CPU is recommended
-
Enough memory (RAM) to not run out of memory. Large images and complex workflow require large amounts of RAM. Learn more below how to experimentally determine Breeze memory requirements for your data.
-
A fast SSD for the Workspace folder used by Breeze
-
Determining maximum frame rate for cameras with high resolution and number of bands
A high-resolution camera with many bands, like the HySpex VNIR-3000 with 3000 pixels x 700 bands, results in large volumes of data.
If you configure a high frame rate (short frame period), you may run into the limit of what the system can handle. This shows up as:
-
growing memory consumption of the Runtime process, which can be seen in for example Windows Task Manager and in extreme cases memory of the PC may run out, causing system instability.
-
log entries in the Runtime log that shows a build-up of data in the send queue:
2026-04-09 11:05:55.8801 [.NET TP Worker] WARN Prediktera.Breeze.Runtime.Tcp.DataStreamTcpServer - DataStream: Send queue size reached 100 MB. Number of elements in queue 21
2026-04-09 11:06:01.0189 [.NET TP Worker] WARN Prediktera.Breeze.Runtime.Tcp.DataStreamTcpServer - DataStream: Send queue size reached 5300 MB. Number of elements in queue 1164
-
You may also see an
SendQueueOverflowerror in the Runtime’s Event stream.
These problems can happen when you use Breeze Settings, for example on the Focus page.
It can also happen when third-party code reads the Data stream and cannot keep up reading data fast enough. Learn more about the Data stream in Developers reference guide.
Determining Breeze memory requirements
Analyzing large data with complex workflows in Breeze require lots of memory (RAM). Since the Analysis Trees largely determines the memory consumption - the more complex, the higher memory usage, the following method can be used to determine how much memory is required.
It works by using Windows Task Manager to monitor memory usage while running Breeze to analyze representative hyperspectral data for the target application with an Analysis Tree.
Requirements and preparations
-
A hyperspectral image taken of the sample you want to analyze in Breeze. Ideally it should be taken with the target hyperspectral camera and use real samples to be possible to analyze in Breeze in a realistic way.
-
An Analysis Tree workflow of similar complexity that you intend to use. Use segmentations and descriptors to make it realistic. Workflow Analysis Tree and applying changes
-
Start Windows Task Manager, and on the Processes tab, type breeze to filter the list.
-
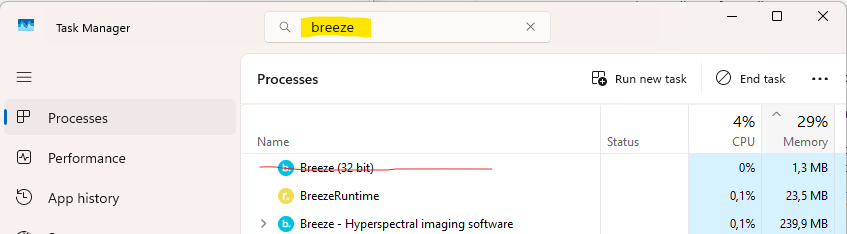
As you can see in the screenshot, Breeze consists of more than one process, and you need to monitor both the Breeze application and the BreezeRuntime process (Breeze (32-bit) is a launcher that won’t use much memory and thus can be ignored). Learn more on the Breeze architecture in Breeze system overview.
How to see memory usage
For each step below, make a note of the Memory usage from Task Manager for both Breeze and the BreezeRuntime:
-
Start Breeze and open a project.
-
Import an image. Make a note of the size of the image in number of frames (pixel lines).
-
Create the Analysis Tree you plan to use.
-
Do Apply Changes on your image.
Now you know the memory consumption of that image with that exact workflow. The next steps can be to extend the tests:
-
Make a small change in the Analysis Tree and re-do Apply Changes. Repeat a few times to stabilize memory usage.
-
Try with an image of different size (double the size, half the size), to determine how large images you can analyze
-
Modify the Analysis Tree to make it more complex (realistic) and see how it affects memory usage, or simplify it if possible
Determining the maximum throughput for a real-time workflow
When the Runtime runs a workflow in real-time it uses buffers and queues to temporarily cache data before it has run through the analysis tree. If the workflow is configured to run faster than the PC can keep up with, a FrameQueueOverflow is triggered and logged to Runtime log. When this happens, the Runtime will drop (throw away) data to keep up.
To find the maximum speed a workflow can run, you can use Breeze to manually apply your Analysis Tree and then examine the log files to see how fast it could run:
-
Configure Breeze to show the Runtime console in a terminal window as described inWorkspace Settings, and restart Breeze to make the terminal window show up.
-
In Breeze, select a few measurements with representative data.
-
Hold down Ctrl + Shift and click Apply Changes. Workflow Analysis Tree and applying changes.
-
Examine the Runtime.log (or Runtime console Windows) and look for the
INFOoutput forApplyChangeswhich will show the throughput: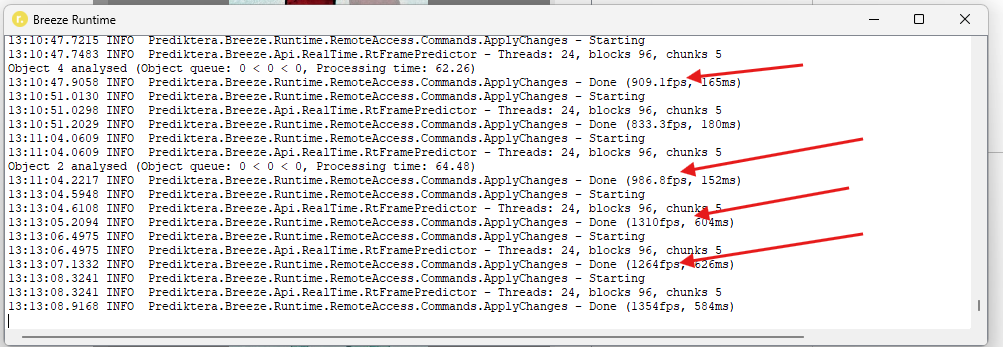
If you find your Analysis Tree is too slow for your target application, you need to make changes. Refer to the beginning of this page for info on what affects performance.
There is also built-in Diagnostics which you can run in your environment to diagnose a workflow running in the Runtime as described next.
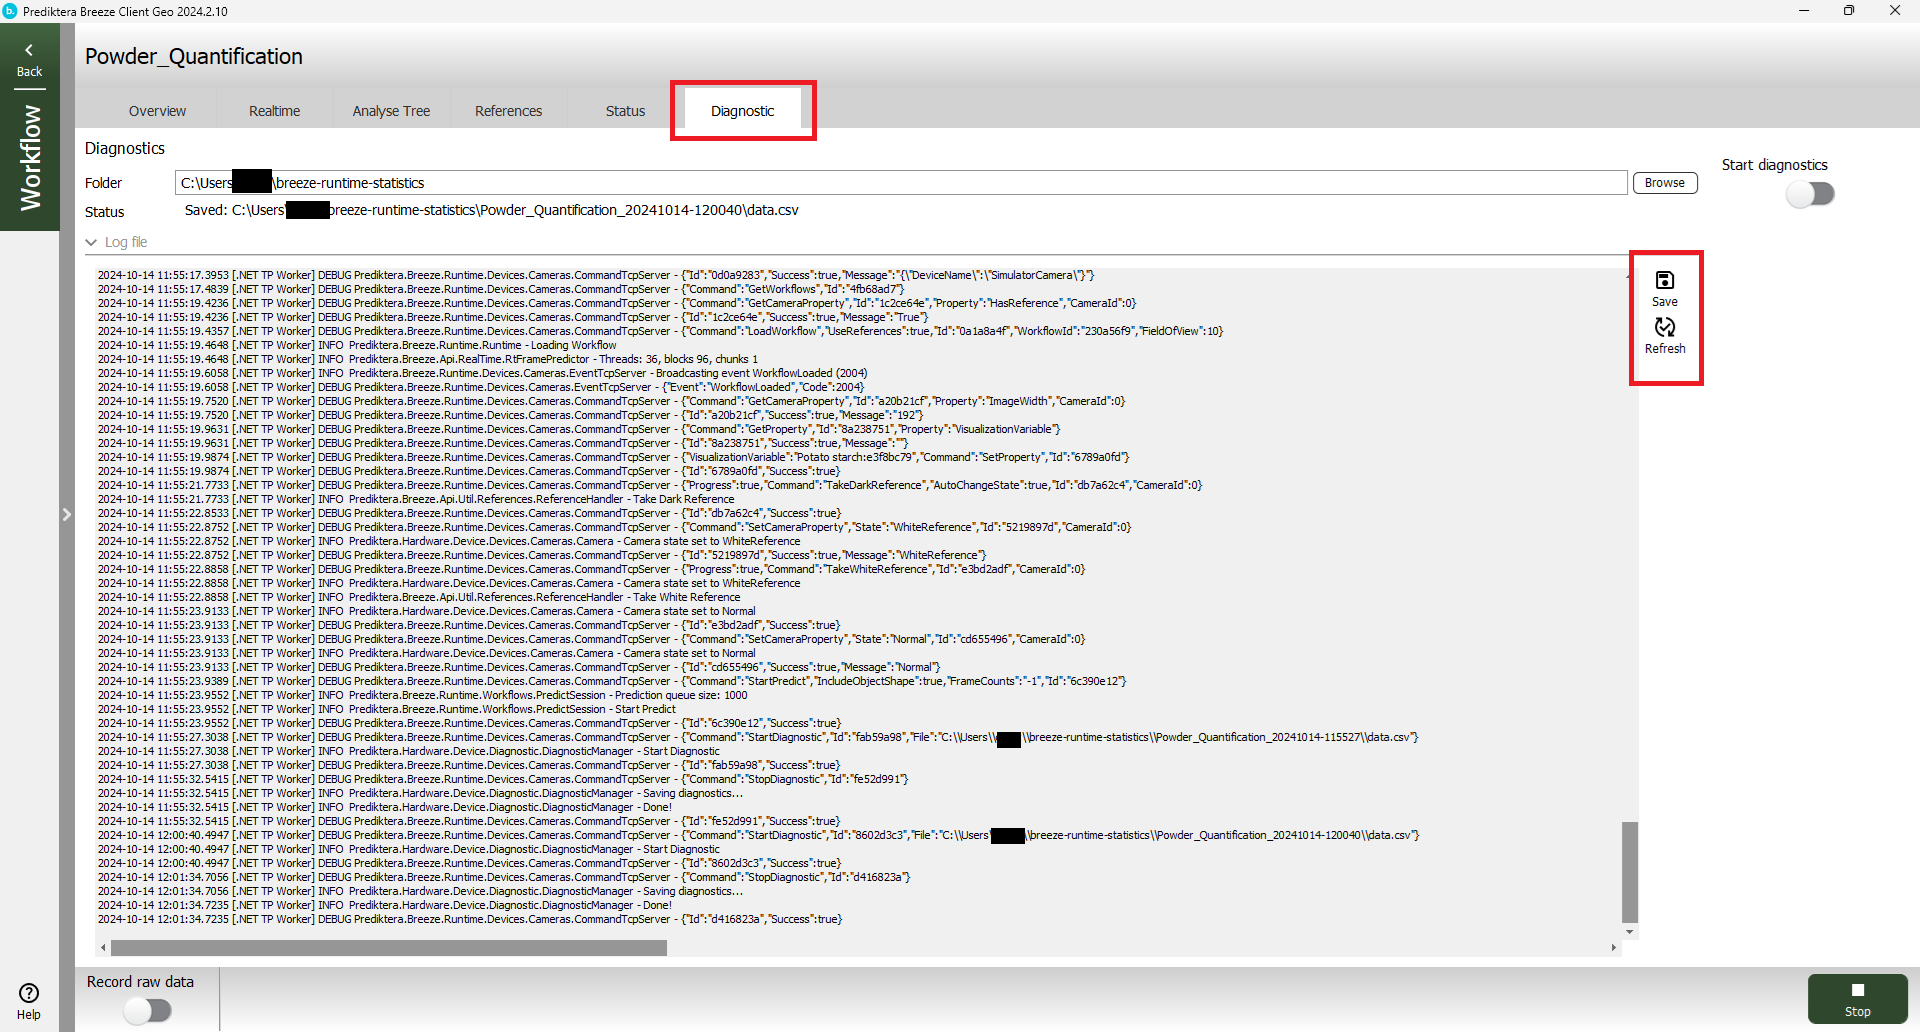
Running Diagnostics in the Breeze Client
Start Breeze Client and go to the Diagnostics tab.
Start diagnostics using the Start diagnostics switch:
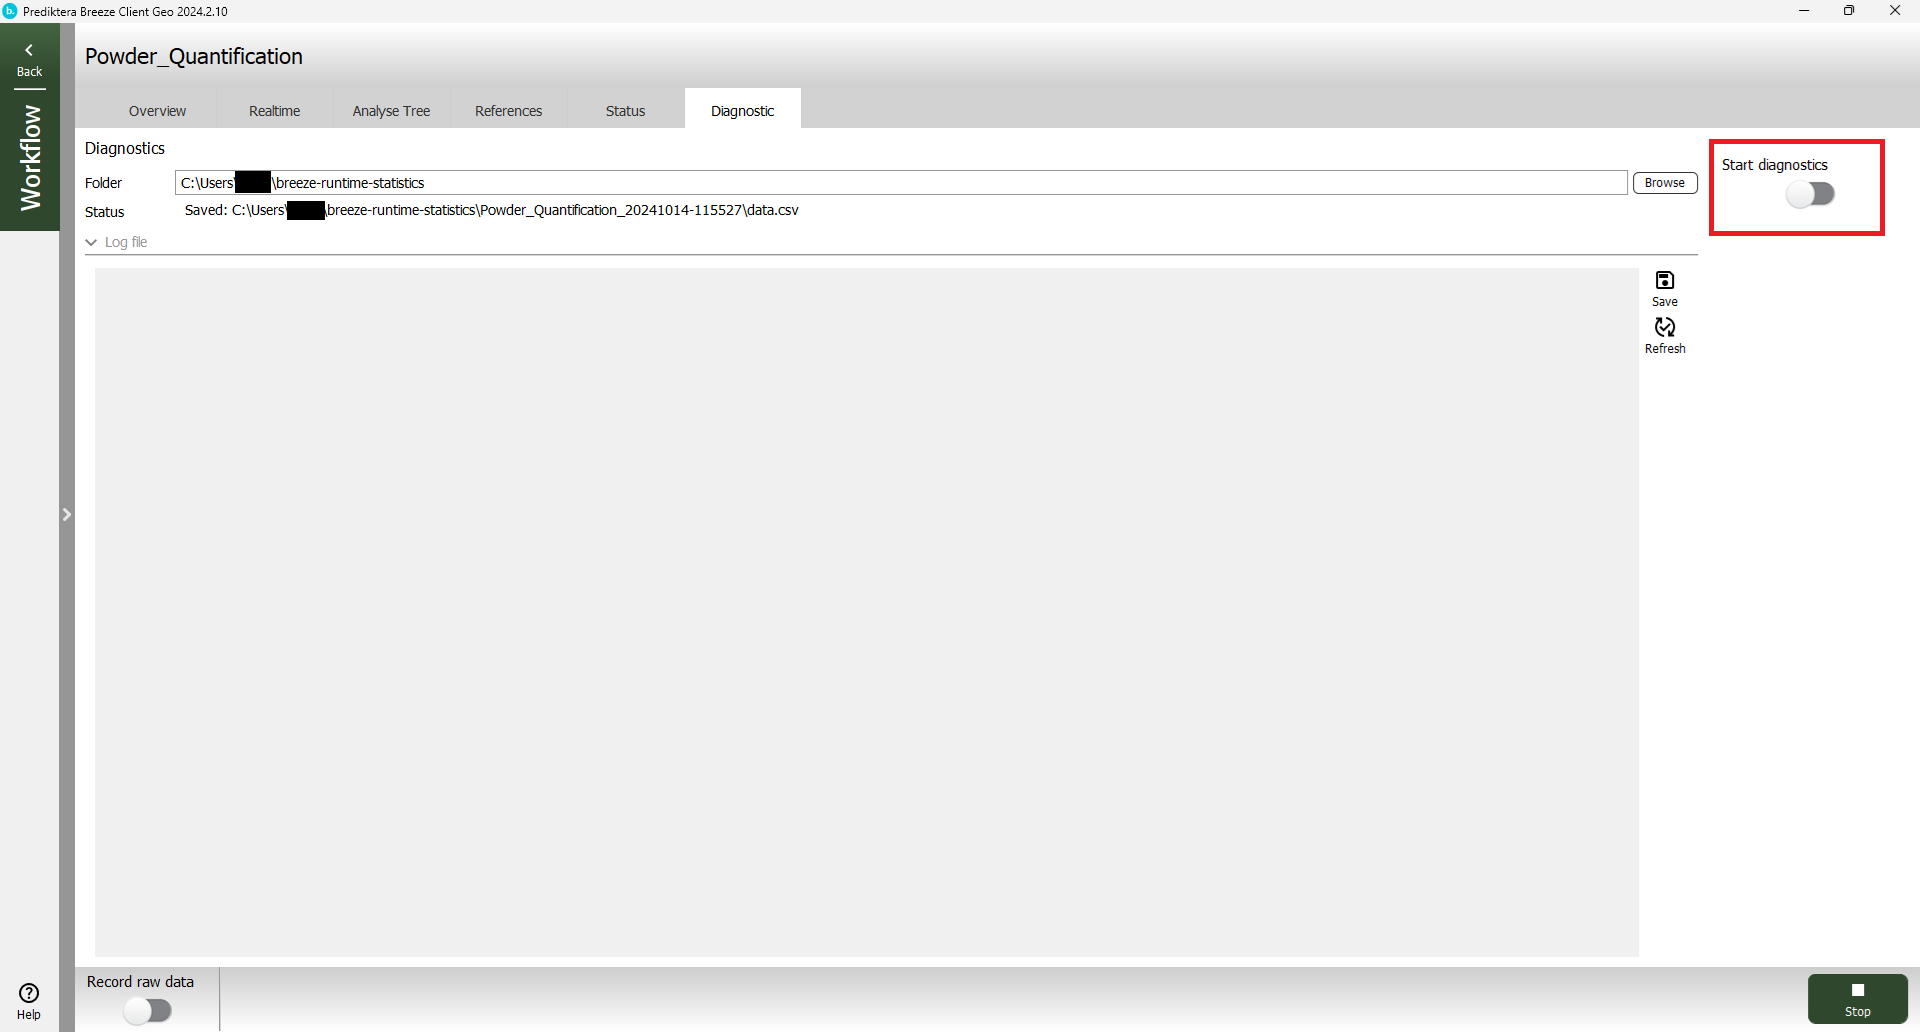
This starts capturing data from the running workflow to the folder displayed at the top of the Diagnostics screen.
When you click the switch again, the recording is stopped. The captured log and performance data is saved in a data.csv file, and statistics plots are automatically created in the in the specified breeze-runtime-statistics folder. This folder is automatically opened in File Explorer.
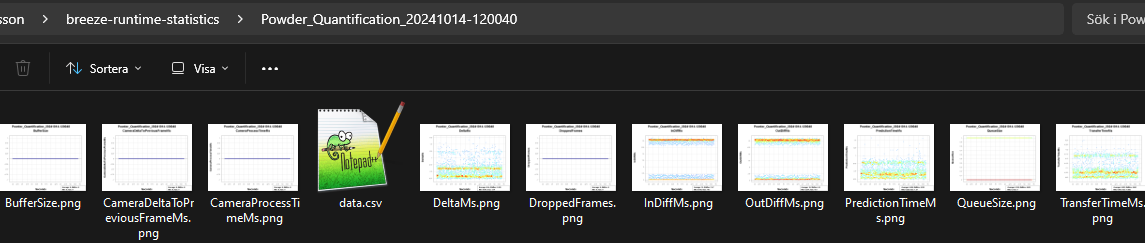
Double-click on the plots to see them. Learn more below on the data you see.
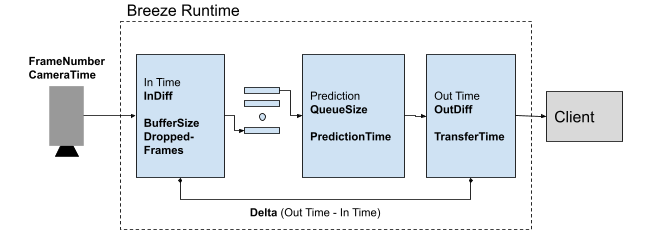
The diagnostic information overview
|
Name |
Description |
Unit |
|
|
Incrementing number started at 1 |
Number |
|
|
Seconds from diagnostic start |
Seconds |
|
|
Frame number from camera |
Number |
|
|
Not implemented |
|
|
|
Time difference between two In frames from camera |
milliseconds |
|
|
Number of dropped frames |
Number |
|
|
Elements in camera line buffer |
Number |
|
|
Elements in prediction frame queue |
Number |
|
|
Prediction time |
milliseconds |
|
|
Time difference between two Out frames |
milliseconds |
|
|
Time difference between In and Out Time |
milliseconds |
|
|
Transfer time to client |
milliseconds |
Command
This Runtime command can be used programmatically to start diagnostics from a third party client.
StartDiagnostic(File = Absolute file path)
.....
StopDiagnostic()
The Data.csv file is saved in the file path when StopDiagnostic is called as described above.
Breeze Runtime Logging
The Breeze Runtime log files contain events that are useful for troubleshooting. Learn more in Breeze log files and troubleshooting.
The Runtime log can be seen in Breeze Client under Diagnostics. This log information is updated manually using the Refresh button and can be exported by clicking on the Save button.