Perform calculations, per pixel or object, using arithmetic and logical expressions of spectral band values.
Parameters
Expression
Operators than can be used expressions include the data operators wNNN and bMMM for referring to wavelength bands, the range operator : used for averaging data, standard arithmetic (+,-,/,* …) and comparison operators (=,>,< …) as well as some mathematical functions (
…) and constants (
).
Breeze does not validate the provided expression until you click Apply changes to apply it to some data.
|
Data Operator |
Description |
|---|---|
|
|
Wavelength lookup operator that finds the wavelength band closest to the provided number A setting controls how far off a wavelength is allowed to be to be considered a match. If there isn’t matching data an error is displayed when applying the workflow to data. Learn more in Wavelength matching. Example of this syntax: |
|
|
Band index operator. If the index |
|
|
Average range operator that returns the average value for a range of wavelength bands. For example: |
Expand to see all available operators
|
Arithmetic Operator |
Description |
|---|---|
|
|
Subtract |
|
|
Add |
|
|
Divide |
|
|
Multiply |
|
|
Modulo |
|
|
Raised to a power |
|
Comparison Operator |
Description |
|---|---|
|
|
Equal to |
|
|
TRUE if any of the conditions separated by OR is TRUE |
|
|
TRUE if all the conditions separated by AND is TRUE |
|
|
Not equal to |
|
|
Less than |
|
|
Less than or equal to |
|
|
Greater than |
|
|
Greater than or equal to |
|
Function operator |
Description |
|---|---|
|
|
|
|
|
|
|
|
|
|
|
|
|
|
|
|
|
|
|
|
|
|
|
|
|
Constants |
Description |
|---|---|
|
|
Always evaluates to TRUE |
|
|
Always evaluates to FALSE |
|
|
|
|
|
|
To average over a spectral region, the following expression is used “:”, see example 2 below.
Type
If the expression should be applied to pixels in an image or entire objects
-
Object
-
Average spectrum for each object
-
-
Pixels
-
Values for each pixel in the object
-
Min
The minimum value used in the visualization of the object in the Table, corresponding to the darkest blue color seen in the Legend. Values lower values than Min will also be displayed with the same color.
This limit can also be specified and auto-adjusted by right-clicking in the Legend in Table.
Max
The maximum value used in the visualization of the object in the Table, corresponding to the darkest red color seen in the Legend. Values higher than Max will also be displayed with the same color.
This limit can also be specified and auto-adjusted by right-clicking in the Legend in Table.
Smooth
Smooth prediction result using median filter kernel
-
None
-
No Smoothing prediction.
-
-
Low
-
Smoothing using median filter kernel with 5x5 pixel box
-
-
Medium
-
Smoothing using median filter kernel with 10x10 pixel box
-
-
High
-
Smoothing using median filter kernel with 15x15 pixel box
-
Examples
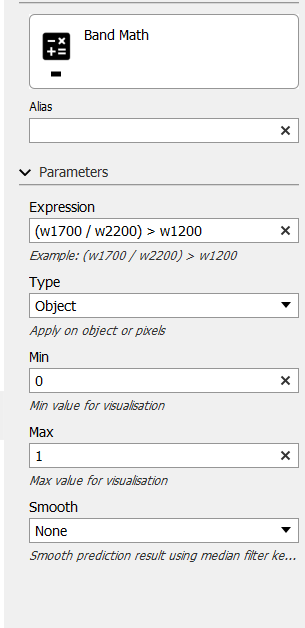
Example 1
In this example, we aim to investigate whether the ratio between two wavelengths is larger than that of another wavelength for the object average spectrum. In expression, we write the following
(w1700 / w2200) > w1200
This will returns 1 if the ratio of intensity between bands at 1700 nm and 2200 nm is larger than the value of intensity at 1200 nm.
For type, we choose 'object' to focus only on the segmented object average.
The min and max are left at 0 and 1, respectively
The parameters for the descriptor should look like this
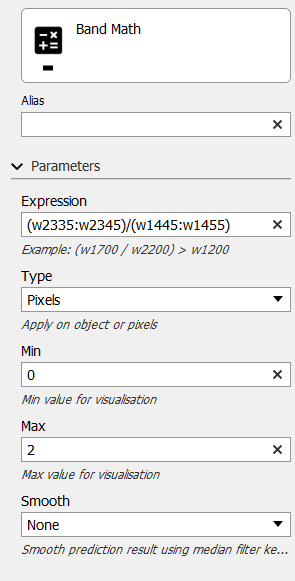
Example 2
In this example, we investigate the ratio between two wavelength averages on the pixel level.
The expression we will use is
(w2335:w2345)/(w1445:w1455)
For Type, we leave it at 'pixels'.
Min is left at 0, but max is changed to 2.
The parameters in the software should look like this