Recorder is the component used to capture hyperspectral data from cameras to measurements saved in a project in Breeze. Recorder can also be used to test-run workflows with real-time data.
This page describes the Recorder features. If you prefer step-by-step guides, go to Breeze Recorder or the HySpex-specific Breeze HySpex Recorder Guide.
Overview
Select or open a project, and then click the Recorder button 
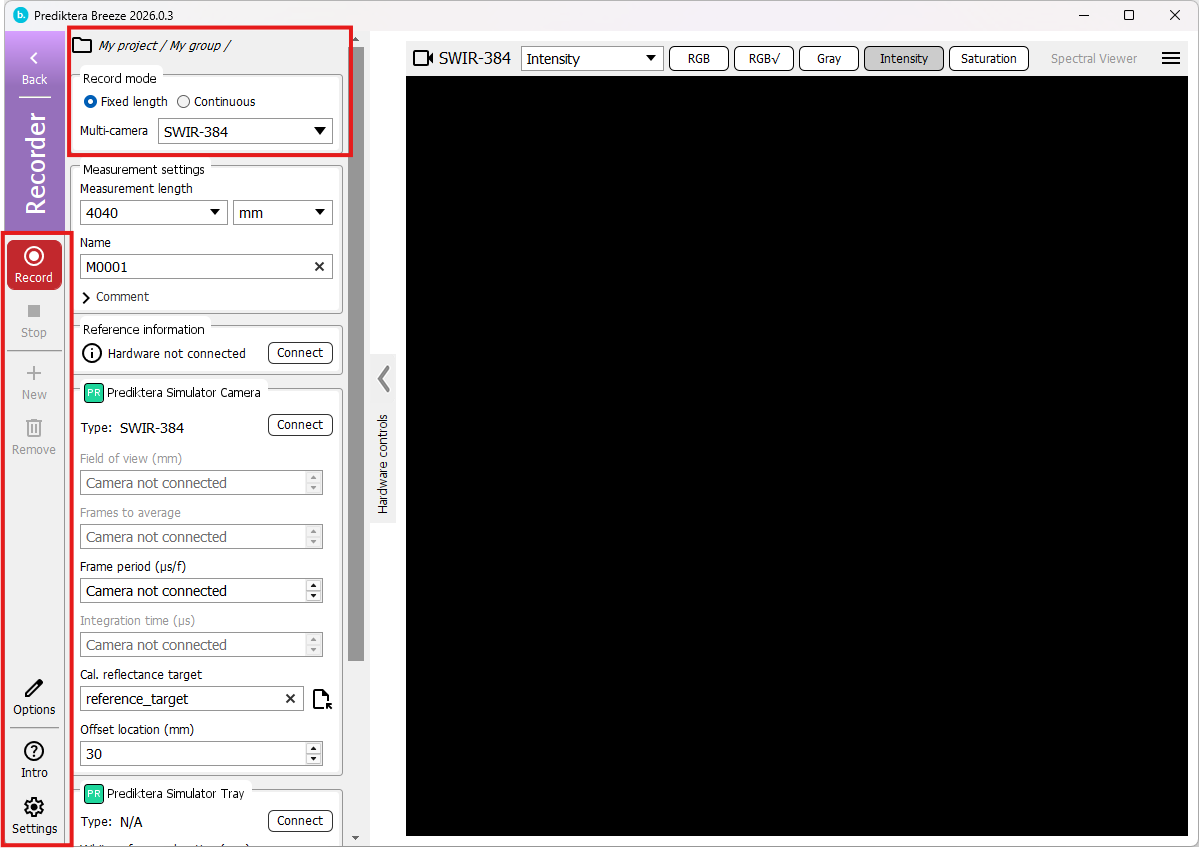
At the top-left you control global settings for Recorder:
-
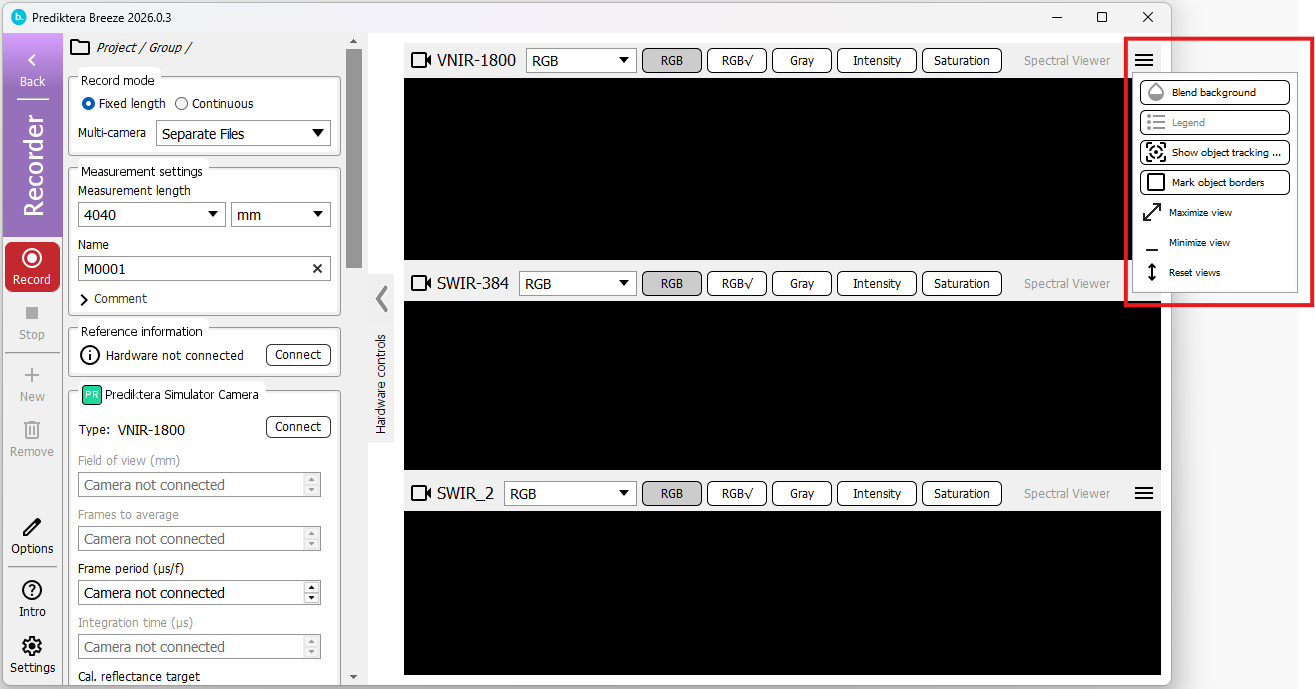
Switching recording modes at the top-left of Recorder (highlighted with a red box in the screenshot):
-
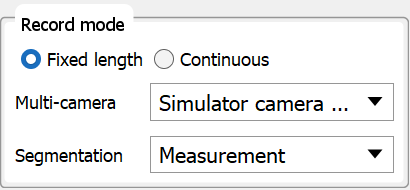
Record mode Fixed length is the main mode of Recorder, where images are recorded from a hyperspectral camera and saved to disk for analysis in Breeze
-
The other mode, Continuous, is for test-running workflows with live data from a camera. This is described at the end of this page.
-
-
The current project and the group where recorded measurements will be saved are displayed at the top (“My project” and “My group” in this example).
-
If the system is Using multiple cameras, you switch the multi-camera mode at the top left. For example, you can select to use a single camera at the time, or use Separate files, to record with all cameras simultaneously.
At the left margin, there are buttons for recording data (described later), but also buttons for
-
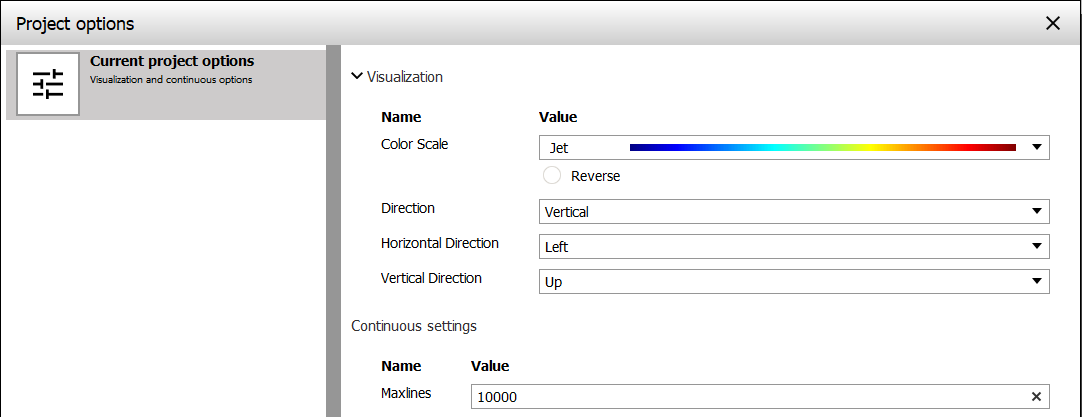
Options - display the Project options that apply for Recorder for the open project. This includes the visualization direction (horizontal or vertical) and the color scale.
-
Intro - displays some helpful links
-
Settings - display the Workspace Settings shared between all projects in the workspace. This includes all settings for cameras.
When Breeze records data, it is saved in a specific File format.
Fixed length recording and shared visualization features
Fixed length recording is the common use-case where images are recorded from a hyperspectral camera and saved to disk for data analysis in Breeze. Here’s how you use it:
-
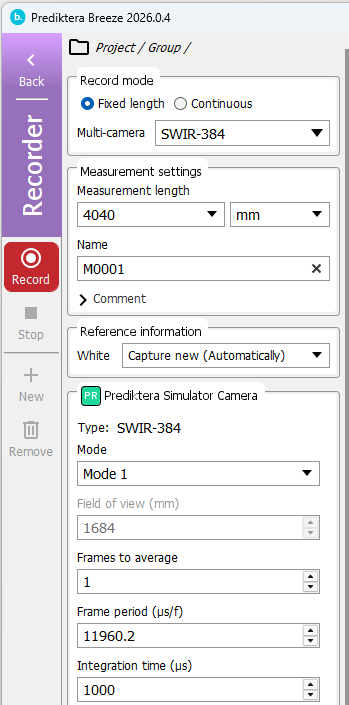
Control the hardware on the left part of the screen:
-
Connect the camera hardware to be able to use it.
-
Set frame rate and integration time and other camera settings
-
Control an optional Sample Mover to move it to certain positions.
-
Configure how references are used. Dark and White References
-
-
Specify the name and size of the measurement. Add an optional comment that will be added to the metadata of the measurement.
-
Click the Record-button to start recording.
-
During recording you can Stop it, if required
-
During (or after recording), you can change how the live recording is visualized (for example as RGB, Intensity or Saturation) as explained in the next section
-
-
After a recording of a measurement completes:
-
Launch Spectral Viewer from the top toolbar to investigate all hyperspectral data in the image
-
Optionally Remove the recorded measurement.
Use + to record another one.
-
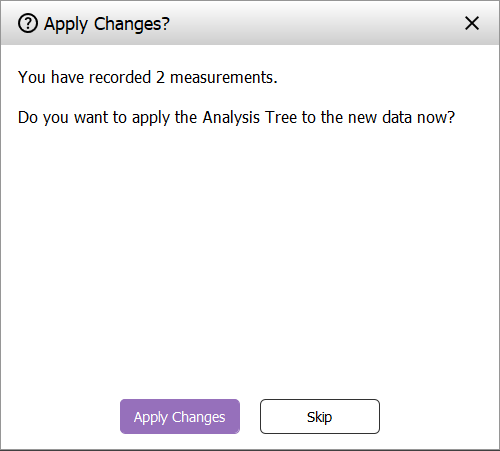
Exit Recorder by clicking < or Done after recording. You are prompted if you want to apply the Analysis Tree to the data. You can always do this later using the Apply Changes button as described in Workflow Analysis Tree and applying changes.
-
Recorder visualization
You can control the visualization of the recording in real-time, or after saving a measurement, using the top toolbar. Here there are buttons for:
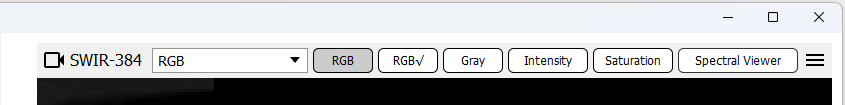
-
Descriptor - view data from the Analysis Tree when it is applied in real-time during recording. This is the default behavior for Continuous recording mode, but for Fixed length an option can be changed to enable this feature. Learn more below.
-
RGB - use data from three wavelengths from the hyperspectral data to create a pseudo-RGB image. These wavelengths are typically configured in the camera settings.
-
Square root of RGB - same as RGB but by using the square root it can become easier to see smaller differences
-
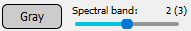
Gray - view data for a single band/wavelength. Change band using the slider.
-
Intensity - maximum intensity (0 to 100%) in any band for each pixel. Can be used to find saturated pixels. Tip: toggle the legend with the toolbar button under the rightmost menu button. Also see the Saturated pixels descriptor.
-
Saturation - percentage of saturated wavelength bands for each pixel. Pixels without saturation will be displayed a gray-scale image of the middle wavelength. Also see the Saturated pixels descriptor.
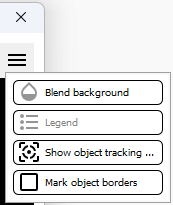
The menu button at the rightmost end contains toggle buttons for
-
Blend background - if the pseudo RGB bands should be blended into the visualization of a Descriptor for the Analysis Tree.
-
Legend - explaining the colors used in the visualization
-
Show object tracking box - if a light gray bounding rectangle should be drawn around the objects identified by a segmentation in the Analysis Tree.
-
Mark object borders - if the outlines of identified objects should be drawn in light gray to make them easier to see.
Real-time data analysis in Recorder
Breeze can run the Analysis Tree workflow in real-time in Recorder.
This is always used for Continuous mode in Recorder, but for Fixed length recordings, real-time analysis is disabled by default to make enable efficient recording of images regardless of complexity of analysis tree, camera resolution or size of recordings. You can enable this is settings, as described below.
When real-time analysis enabled, objects that were identified are visualized in the preview when recording completes. Note: if the Analysis Tree has many segmentation levels, the settings for Segmentation level in the Table view of Breeze is used for this visualization.
Visualizing real-time data from descriptors in the Analysis Tree
The Descriptor button in the top visualization toolbar shows a drop-down for selecting a data analysis descriptor. In the drop down select between:
-
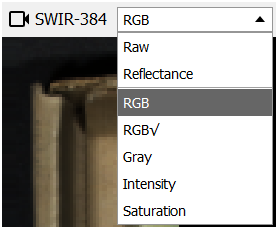
-
Raw / Reflectance / Absorbance / Radiance which can be used to switch between those to see the effect of Dark and White References references and theSpectral imaging modes.
-
Descriptors used in the Analysis Tree. Learn more about data analysis in Workflow Analysis Tree and applying changes.
-
Enabling real-time data analysis for Fixed length recording in Settings
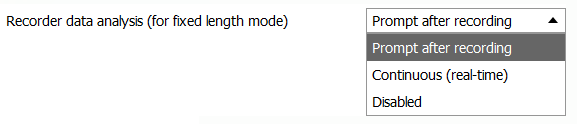
In Workspace Settings on the General page, the option Recorder data analysis (for fixed length mode) has three options
-
Prompt after recording (the default) - recorded measurements are saved to disk, but data analysis is not done in real-time. When you click Done to close recorder, you are prompted if you want to do the data analysis then.
-
Continuous (real-time) - shows analysis tree drop down, unlike the others (but buttons works for the others). Like Breeze before 2026.1
-
Disabled - AT not applied, has to be done manually as indicated by badge
When set to Continuous, you are able to select which segmentation to apply to recordings in the Record mode section, right underneath your selected camera.
Working with multiple cameras in Separate Files mode
When Using multiple cameras in Separate Files mode, all cameras are displayed simultaneously and will be used record individual measurements. You can customize the view to make camera previews larger or smaller:
-
changing the proportions between the cameras by clicking and dragging the borders between the two cameras
-
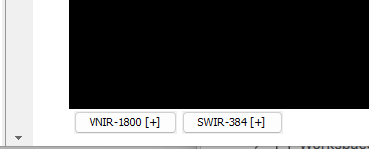
use each cameras menu button (see screenshot) to maximize a camera view to let it use upp all available space. Use the same menu button to restore the view to get back to the previous view
-
to minimize a camera that you don’t want to see a preview for. Minimized cameras are listed at the bottom of the screen
-
Use Reset views to restore to the default view
Continuous (play) recording
Recorder can be used in the Continuous mode where data from the camera is pushed in real-time through the Analysis Tree and visualized. This is a way to test-drive workflows in Breeze without having to export data to the Runtime and run Breeze Runtime Client as described in Introduction to Breeze Runtime development.
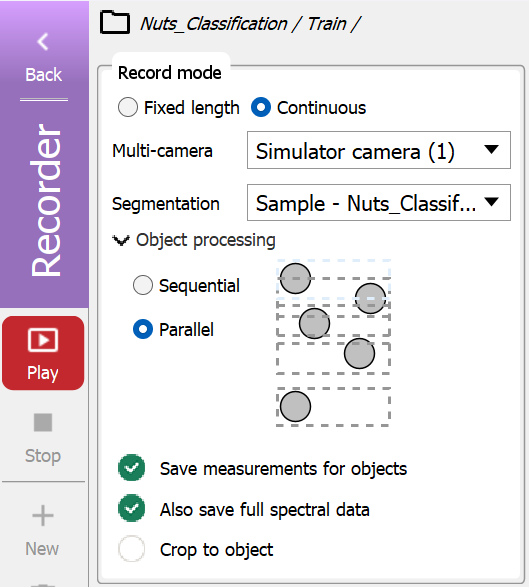
A step-by-step description is shown in Tutorials. Here, the focus is describing the available features of Continuous mode as seen in this picture:
-
There is now a Play button to start the workflow with real-time data from the camera.
-
The Segmentation level controls what segmentations are visualized by the workflow.
-
Object processing determines how the Runtime identifies objects in real-time:
-
Sequential - objects are processed when no objects are detected in front of the camera.
-
Parallel - each object is processed individually as soon as they have passed the camera, even if other objects appear at the same time. This is a more responsive setting than Sequential.
-
-
If there does not exist an Analyse tree, Segmentation, Object processing and Save options are disabled.
Saving image data
Optionally you can select Save image measurements to have the Runtime record the data to disk.
The size of the recorded measurement is determined by the first segmentation level in the Analysis Tree, but is capped by the maxlinessetting in Project options.
Then you have additional options:
-
Select Include spectral raw data to save the full hyperspectral data for each measurement. Otherwise only an RGB thumbnail is saved.
-
Crop tells Breeze to crop each saved measurement to the bounding box of the object, instead of saving the full width from the camera.
-
This is similar to Recording Runtime datawhen using the Runtime API.
While the workflow is running, you can use the top toolbar to switch visualization as described above.
Sample mover specifics
When there is a Sample Mover connected, additional options are added:
-
You can specify the Measurement length as in Fixed mode to control the image dimensions.
-
Demo mode can be enabled in the movers settings panel, and continuously moves the stage back and forth. When this is used, no measurements are saved.