Breeze Modelling: Best Practices
While creating models in Breeze is intuitive, building optimal models requires a strategic approach to data. These guidelines help you navigate the balance between flexibility and model stability.
1. Define Your Design Space
Build models with representative data that covers the full range of conditions your model will encounter in the real world.
-
Design of Experiments (DOE): We recommend using DOE to systematically map your process variables. This ensures your model isn't "blind" to natural variations in your production environment.
Design of experiments - Wikipedia.
2. Organizing Data: Simplified vs. Granular
Breeze allows you to assign Classes, Properties (numerical values), and Identifiers (text labels) at different levels.
-
The Simplified Approach (Recommended): Place only one class or one property type into a single measurement (image). Benefit: This mirrors the structure of the Breeze tutorials and makes it incredibly easy to create, evaluate, and audit your models.
-
The Granular Approach: You can assign unique classes or properties to individual samples within a single measurement. Benefit: This is powerful for complex scenes where many different items are captured at once.
3. The Re-training Trap: Segmentation Sensitivity
Re-training is a common real-world scenario where a model is updated with new data to account for process changes. However, there is a significant risk if your model relies on Segmentations or Excluded Samples in the Analysis Tree.
The Technical Risk: Breeze models are based on the measurement file and the numerical sample indices within that file.
If you change your segmentation logic (e.g., adjusting a threshold), the index that previously referred to a specific sample might now refer to a completely different sample or a background area in that same image.
For example, if you have assigned a specific Class or Property to "Sample #5," and a segmentation change makes the new "Sample #5" a different object, your model will re-train using incorrect labels.
When you re-train models in Breeze in the Modelling wizard, pay attention to the samples that are included in your updated models, so that you use the right data.
Safe Practice: If you plan to re-train frequently, keep your Analysis Tree and segmentation steps consistent. If you must significantly alter how samples are identified, it is often safer to create a new model to ensure your metadata remains synced with the correct pixels.
Retraining a model
If data in the project has been updated, you may want to retrain a model built on that data.
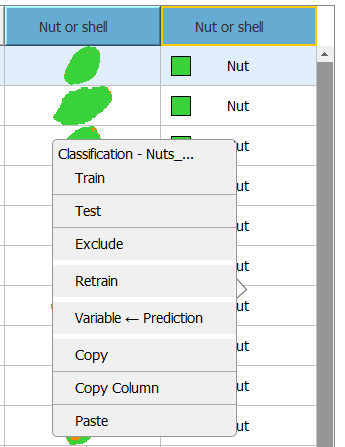
Do this by right clicking a Descriptor in the Table and selecting Retrain.
You then get prompted how you want to fit the model to the data; autofit or keeping the same number of components.
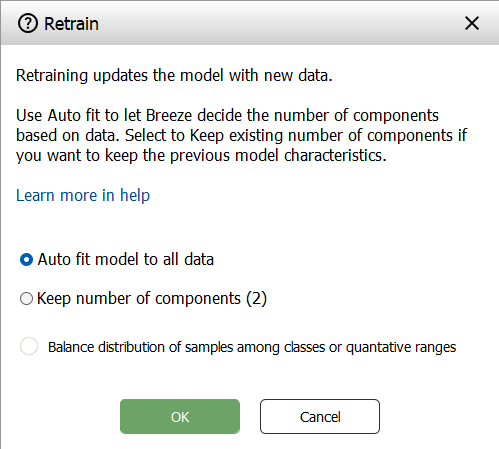
Learn more about Data Balancing below.
When retraining, also bear in mind what is written about on Segmentation sensitivity.
Modelling Wizard usage tips
Selecting rows in the Model wizard
The right Select pane in the Model wizard has commands for quickly selecting rows in the table for further interaction to create the model.
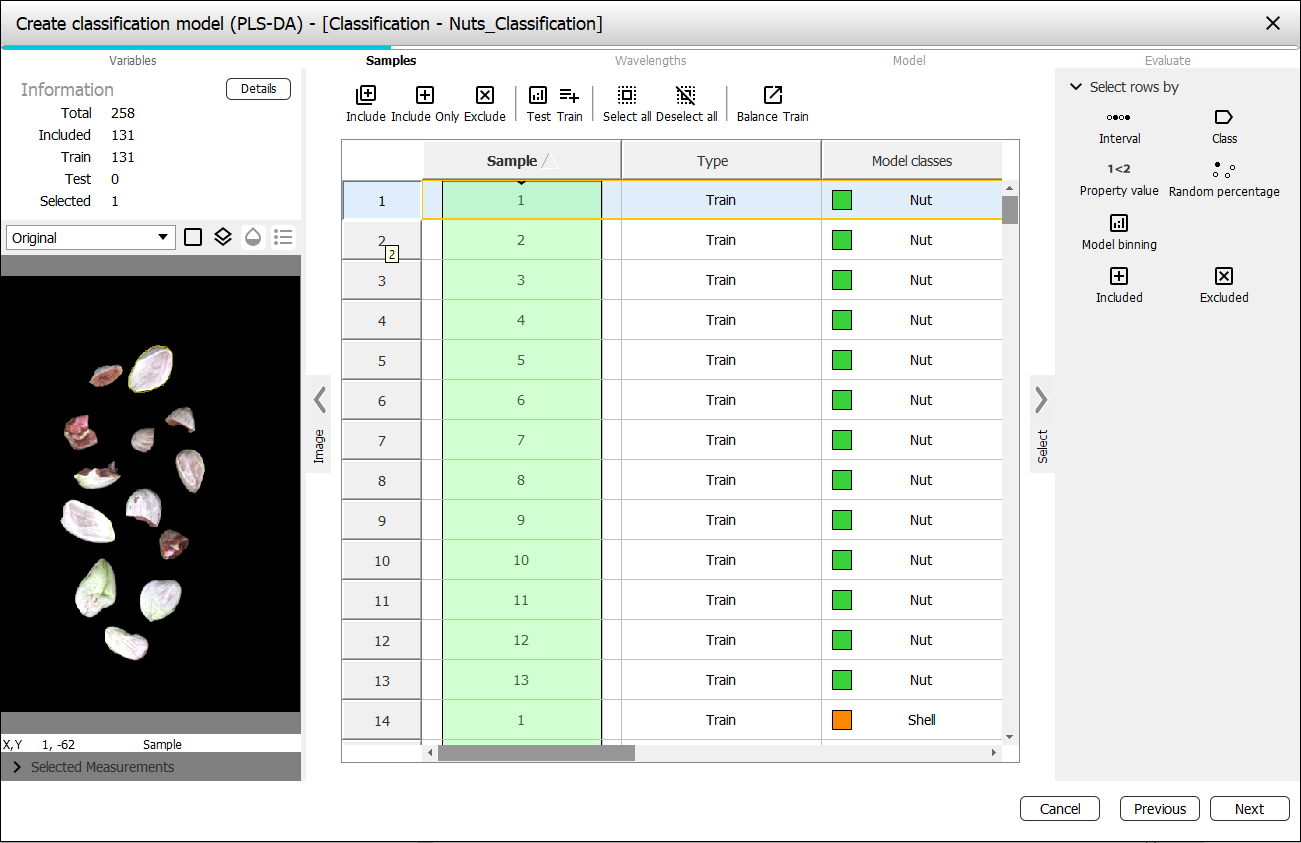
The Select rows by buttons has various commands for selecting rows in the table:
-
Interval - select evenly spaced rows
-
Class - select rows matching a class
-
Property value - select rows which have certain property values
-
Random percentage - select a percentage of rows randomly
-
Model binning - select a percentage of rows by using the model space to distribute the selection evenly. This can be used to remove sparse outliers (noise) and keep the most representative data, resulting in a more stable model.
-
This works by grouping the scatter plot points into a 2D grid (similar to a 2D histogram). Density represents how many pixels fall within the same grid cell. The percentage threshold selects only points whose density is above a given fraction of the maximum density.
-
-
Included, Excluded - select rows that are Included in the model, or Excluded from the model.
You can also select rows in the table manually by clicking. Use Shift + Click to select are region, or Ctrl + Click to select disjoint rows.
After the rows are selected, use the toolbar above the table to act on these rows to for example excluding them from the model, or setting as test data.
Data balancing
Imagine you are training a model to identify sick vs. healthy plants. If your dataset has 900 healthy plants and only 10 sick ones, the model might simply learn to guess "healthy" every time to achieve 90% accuracy.
Balancing prevents this by selecting a subset of your training data where different categories (Classification) or value ranges (Quantification) are represented more equally.
Balancing does not change the test data you have specified.
Balancing for Classification Models
In Classification, your data is divided into distinct categories (e.g., Apple, Orange, Pear).
The Problem: You have 100 samples of "Apple" but only 20 samples of "Orange."
The Solution: Breeze looks at all your classes and identifies the "Smallest Class" (in this case, Orange with 20 samples).
How it works:
1. It groups all samples by their class.
2. It identifies the size of the smallest group.
3. It selects an equal number of samples from the larger groups to match that size.
4. If Shuffle is enabled, it picks these samples randomly; otherwise, it picks them at regular intervals throughout your list.
Balancing for Quantification Models
In Quantification, you are predicting a continuous number (e.g., Sugar Content from 0% to 100%). Since there are no classes, Breeze creates them using a process called Bucketing.
-
Step 1: Create Buckets: Breeze divides your total range of values into a specific number of "buckets" (bins).
-
Step 2: Grouping: Every sample is placed into a bucket based on its value.
-
Step 3: Finding the Target Size: Unlike Classification (which uses the minimum), Quantification uses the Median bucket size.
-
Using the median prevents one nearly empty bucket from forcing the entire model to use almost no data.
-
-
Step 4: Equalizing: * Buckets with too much data are "thinned out" to match the target size.
-
Buckets with very little data are kept as-is.
-
Subpages
-
Cross-validation Cross-validation evaluates model performance by predicting unseen data, with various methods like random, stratified, and leave-one-out techniques to ensure robustness and generalizability.