![]()
![]()
Minimum wavelength mapping (MWL) is a tool to find the absorption features within a specified wavelength region.
A continuum removal is applied to the selected spectral region to enhance the absorption features. The minimum point is identified, and a second-degree polynomial is interpolated using spectral bands around this minimum. From this polynomial, the wavelength corresponding to the absorption feature is calculated. The depth of the absorption feature is determined using the equation:
where
is the value of the continuum removed spectrum at the minimum wavelength
.
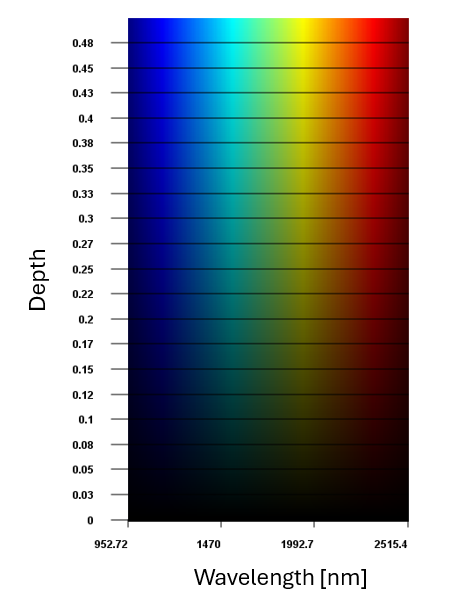
The depth and wavelength position of the absorption feature are visualized using a 2D legend. The color intensity indicates the depth of the absorption feature, while the color represents its wavelength position.
Parameters
Continuum endpoints
Continuum endpoints define the wavelength range for which the continuum removal will be applied.
The wavelength region between 2250nm to 2450nm is written 2250:2450.
If the input window is left empty, the first and last wavelengths of the dataset will be used as the endpoints, and the continuum removal will be performed over the full wavelength range.
Feature range (Optional)
Feature range defines a subset of wavelengths within the continuum endpoints, the wavelength range for which the visualization should be applied. If pixels don't have a minimum within the defined feature range they are colored black and excluded from further analysis.
Eg. The wavelength region between 2375nm to 2395nm is written as 2375:2395
If the input window is left empty the complete wavelength region for the continuum endpoints is used for the visualization range.
Number of peaks
Number of peaks determines how many absorption minima to find within the continuum endpoints wavelength range.
Number of peaks can only be changed if “Show average depth and wavelength” is unchecked.
Depth threshold
The depth threshold is an optional parameter used to exclude pixels with the feature depth/ continuum endpoint wavelength ranges with a depth value below the specified limit. Pixels not fulfilling the threshold will be visualized as black and excluded from further analysis.
If the depth threshold is left at 0 all depths will be considered.
Pretreatments
-
Savitzky-Golay
For more on each type of pretreatment see: Pretreatments
Smooth
Smooth prediction result using median filter kernel
-
None
-
No Smoothing prediction.
-
-
Low
-
Smoothing using median filter kernel with 5x5 pixel box
-
-
Medium
-
Smoothing using median filter kernel with 10x10 pixel box
-
-
High
-
Smoothing using median filter kernel with 15x15 pixel box
-
Show median depth and wavelength
Show median depth and wavelength calculates the median wavelength and depth based on the pixels within a segmented object and displays the result in the table view.
This is mainly useful when exporting to a report.
✅ Calculate and show median depth and wavelength as a column in the table
⬜ Median values are not calculated and visualized in the table.
Example
In the following example, we are interested in the depth and shift of the Al-OH feature around 2200nm.
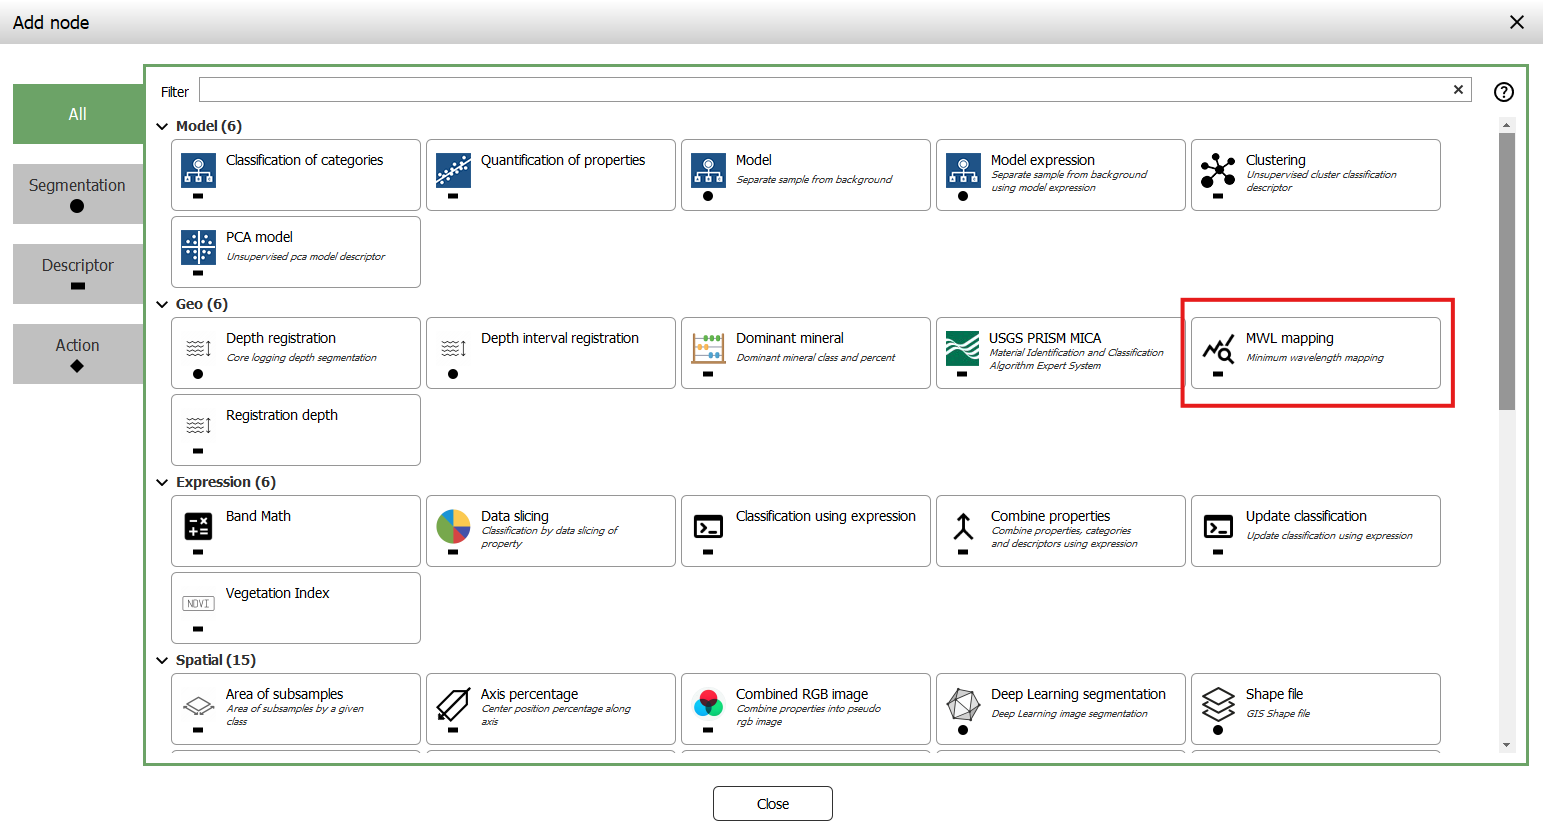
First, we add our MWL mapping descriptor to the analyse tree
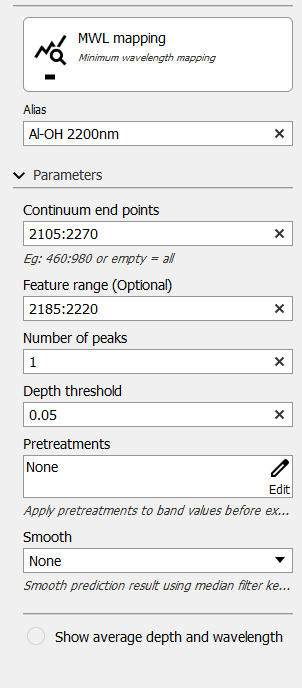
Since we know the feature we are interested in is the Al-OH feature we can give the descriptor the alias “Al-OH 2200nm”. Giving the descriptor an alias makes sure it easier to find the corresponding columns in the table view. The shoulder positions for the feature of interest are between 2105nm and 2270nm, we define this region under “continuum end points” as 2105:2270. The visual range of the feature minima is between 2185nm to 2220nm. To only highlight pixels with a minimum in the visual range the “feature range(Optional)” is defined as 2185:2220. We are only interested in one minimum for each spectrum so the “Number of peaks” is left at 1. To remove potential noise that could be identified as a feature within the visual range the feature needs to at least have a depth of 5% which we define under the “Depth threshold” as 0.05. If you are following the example your MWL mapping parameters should be filled as in the image below
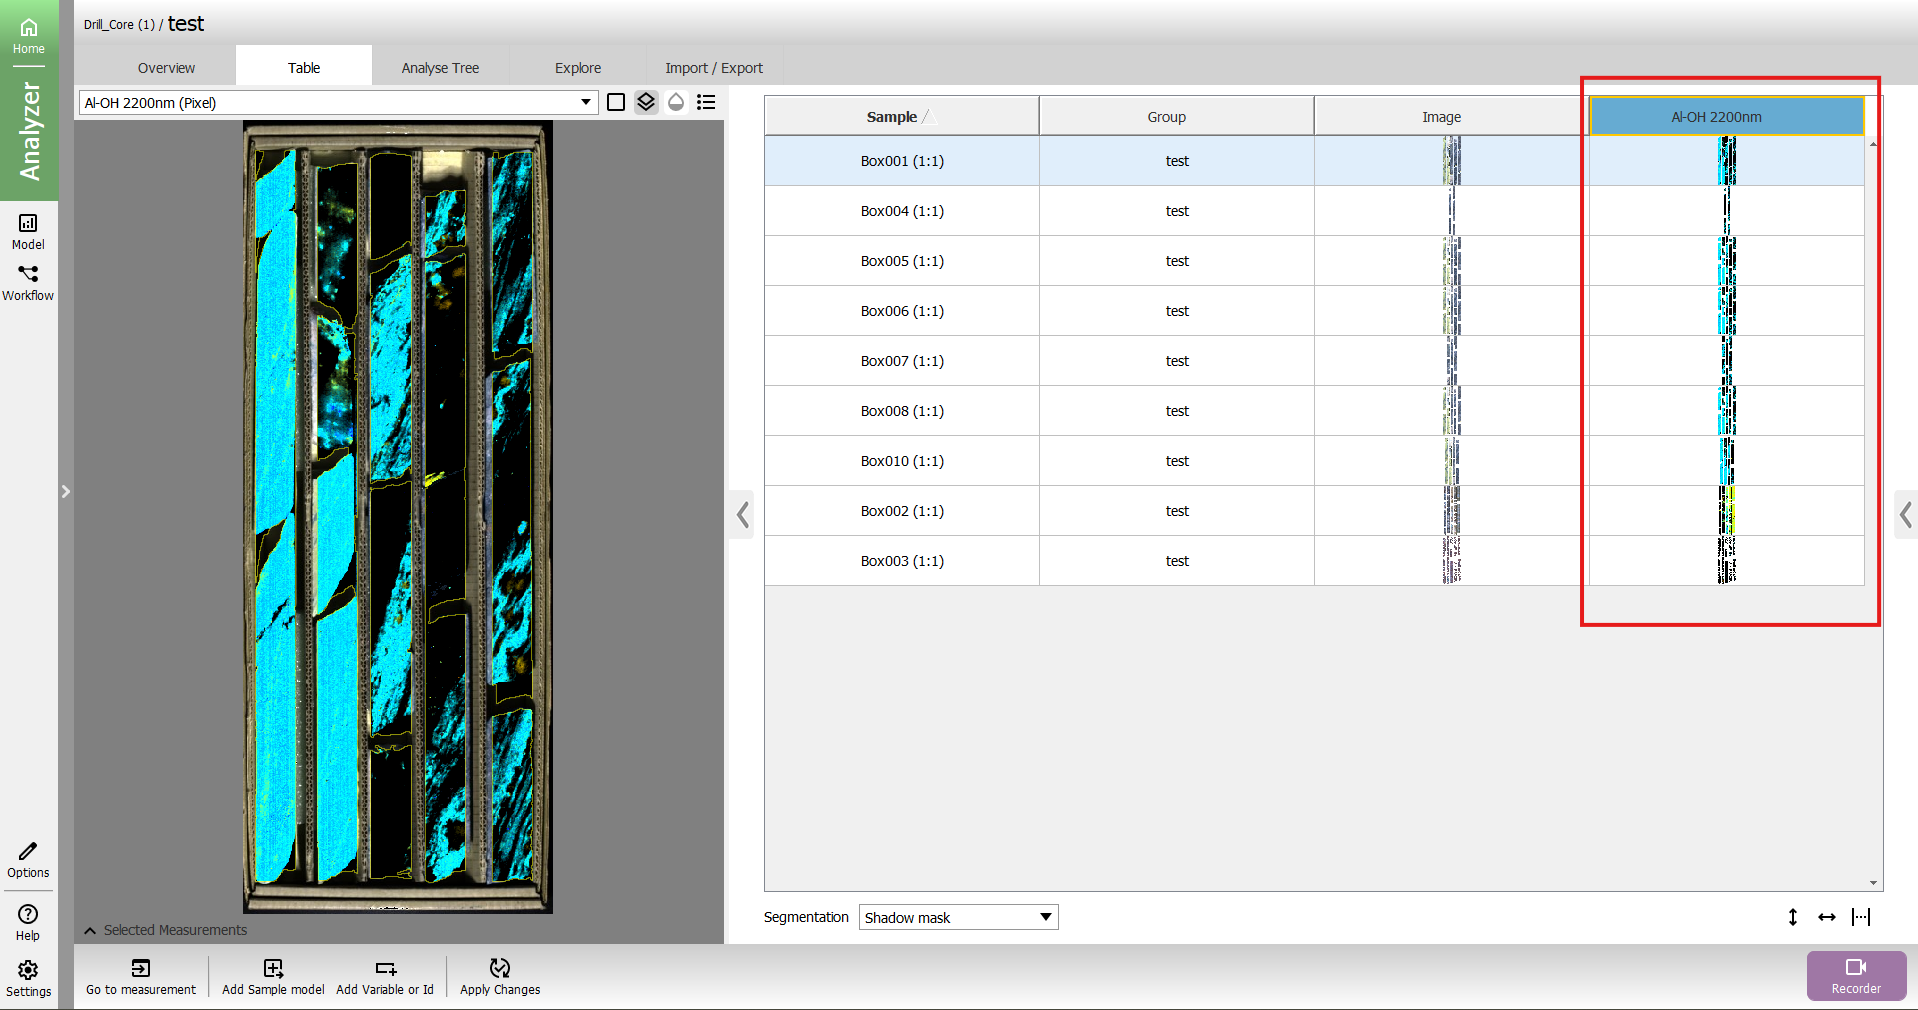
Go to table and press apply changes

You will now have a column in the table with a blue header named “Al-OH 2200nm” as our aias for the descriptor. Press any of the images in the column to visualize the result.
Press the ![]()
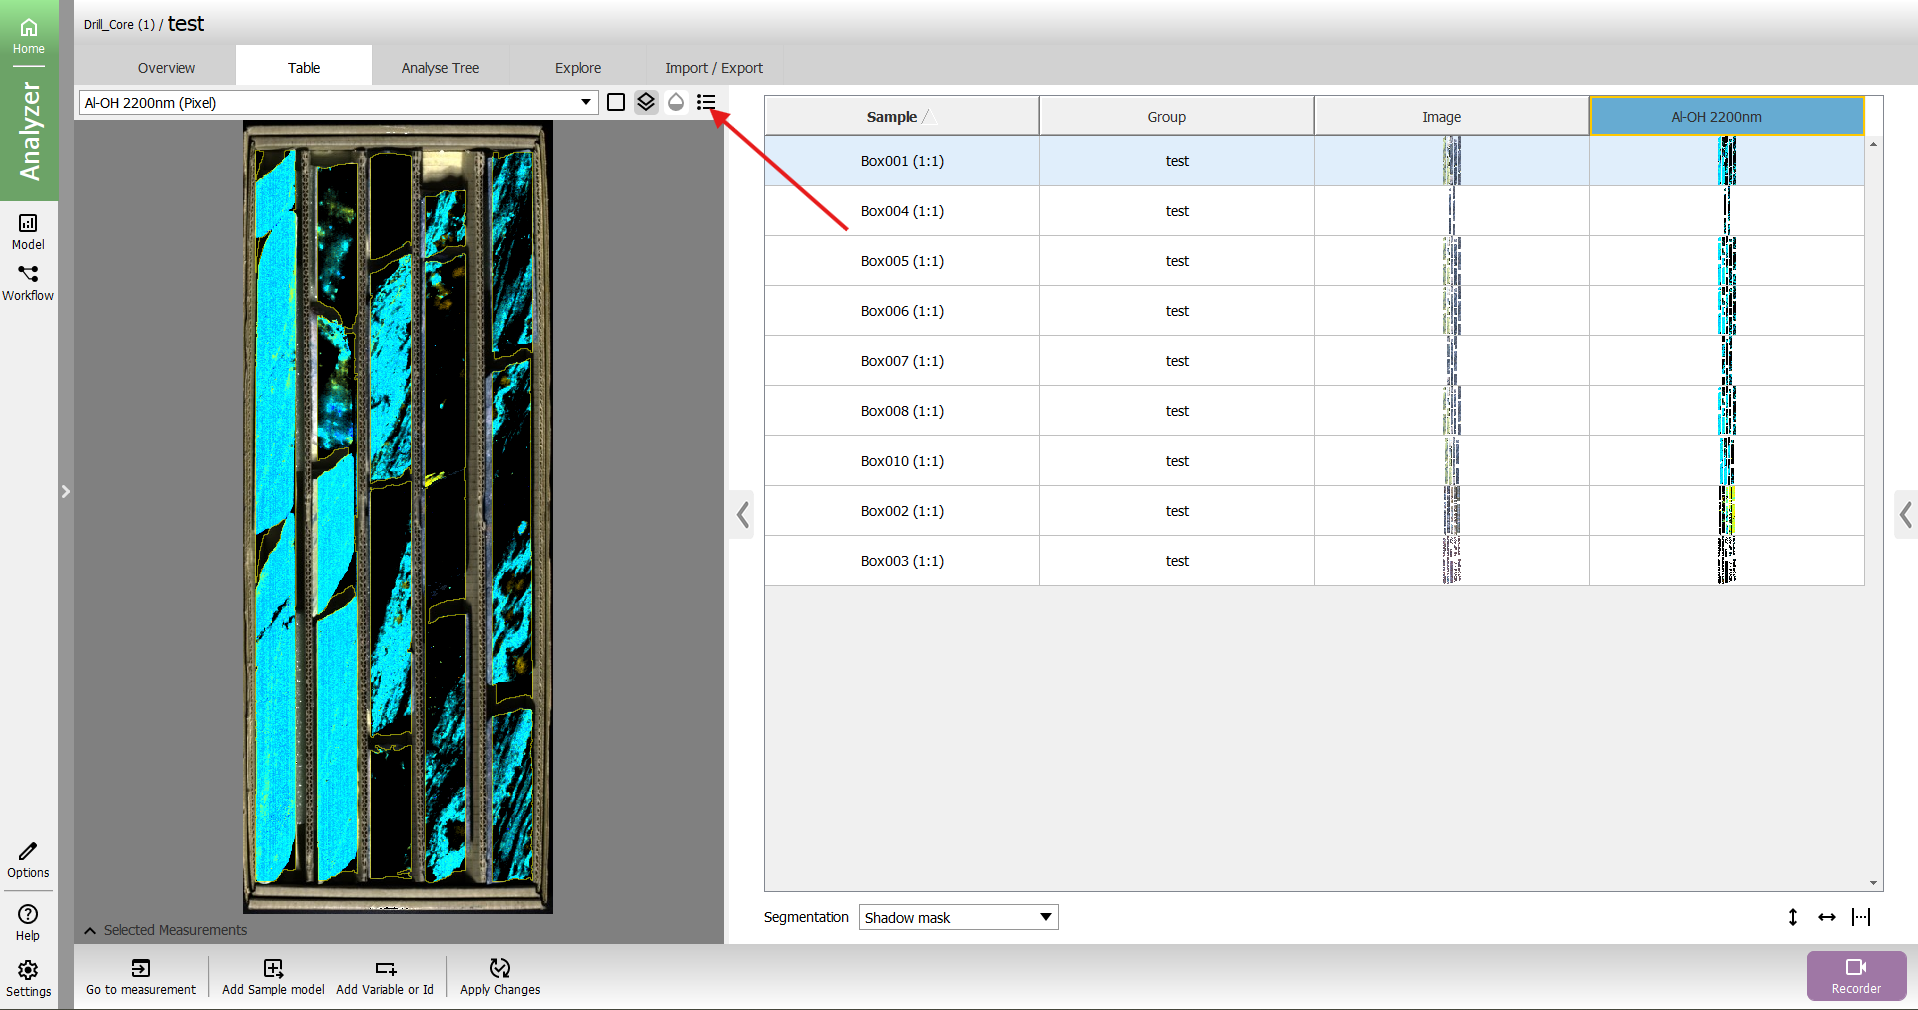
We can now see that the turquoise color has a wavelength position of around 2195nm while the yellow parts are closer to 2200nm.
