This guide will show how to use limits to change the scale for the colors that are used to visualize the result.
Limit will only change the visualizations and will not affect the prediction results.
To follow the example in this guide it’s recommended to first go through Quantification of powder samples.
Limit example with Powder Quantification image data
This section starts after creating a new Workflow with Record data using the Group “Unknown Mix” from Powder Quantification.
-
You should have the following view:
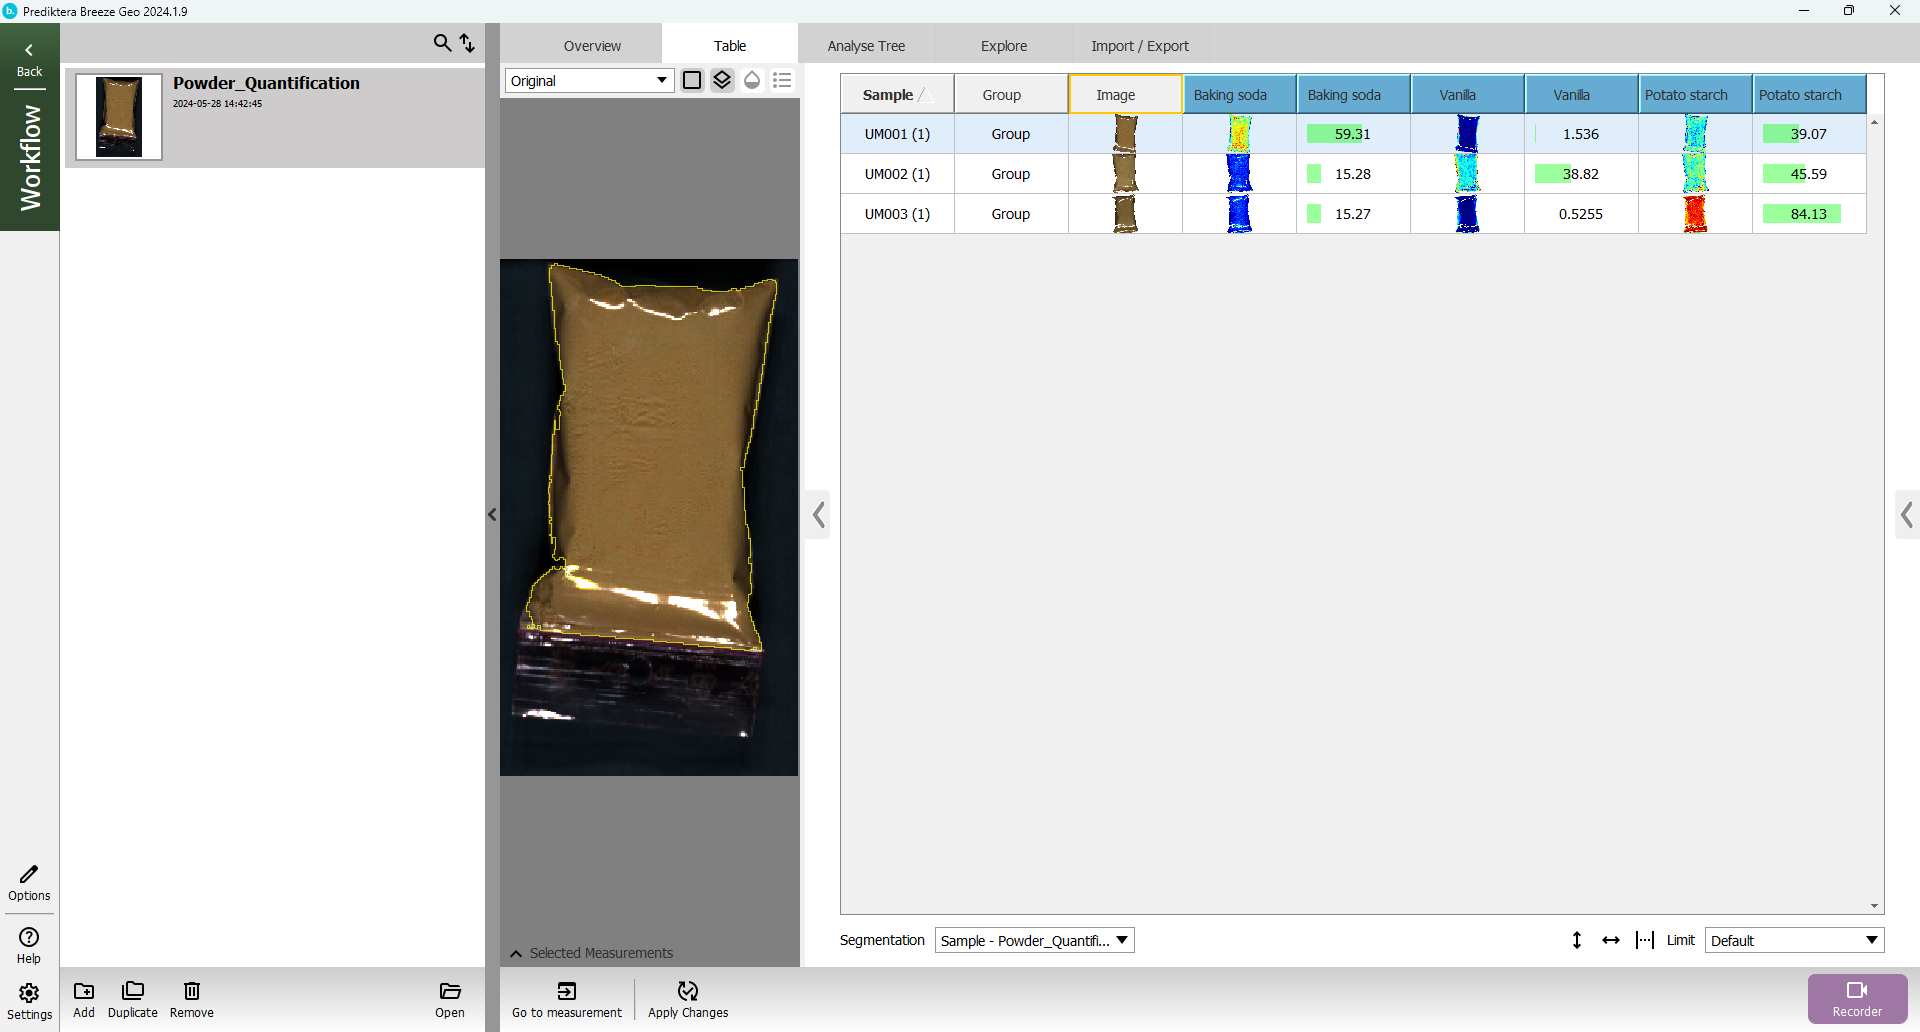
-
Press the Options button

-
The defaultlimits look like this. The limits are by default set by the lowest and highest values in the training set (in this case it was 0 and 100%).
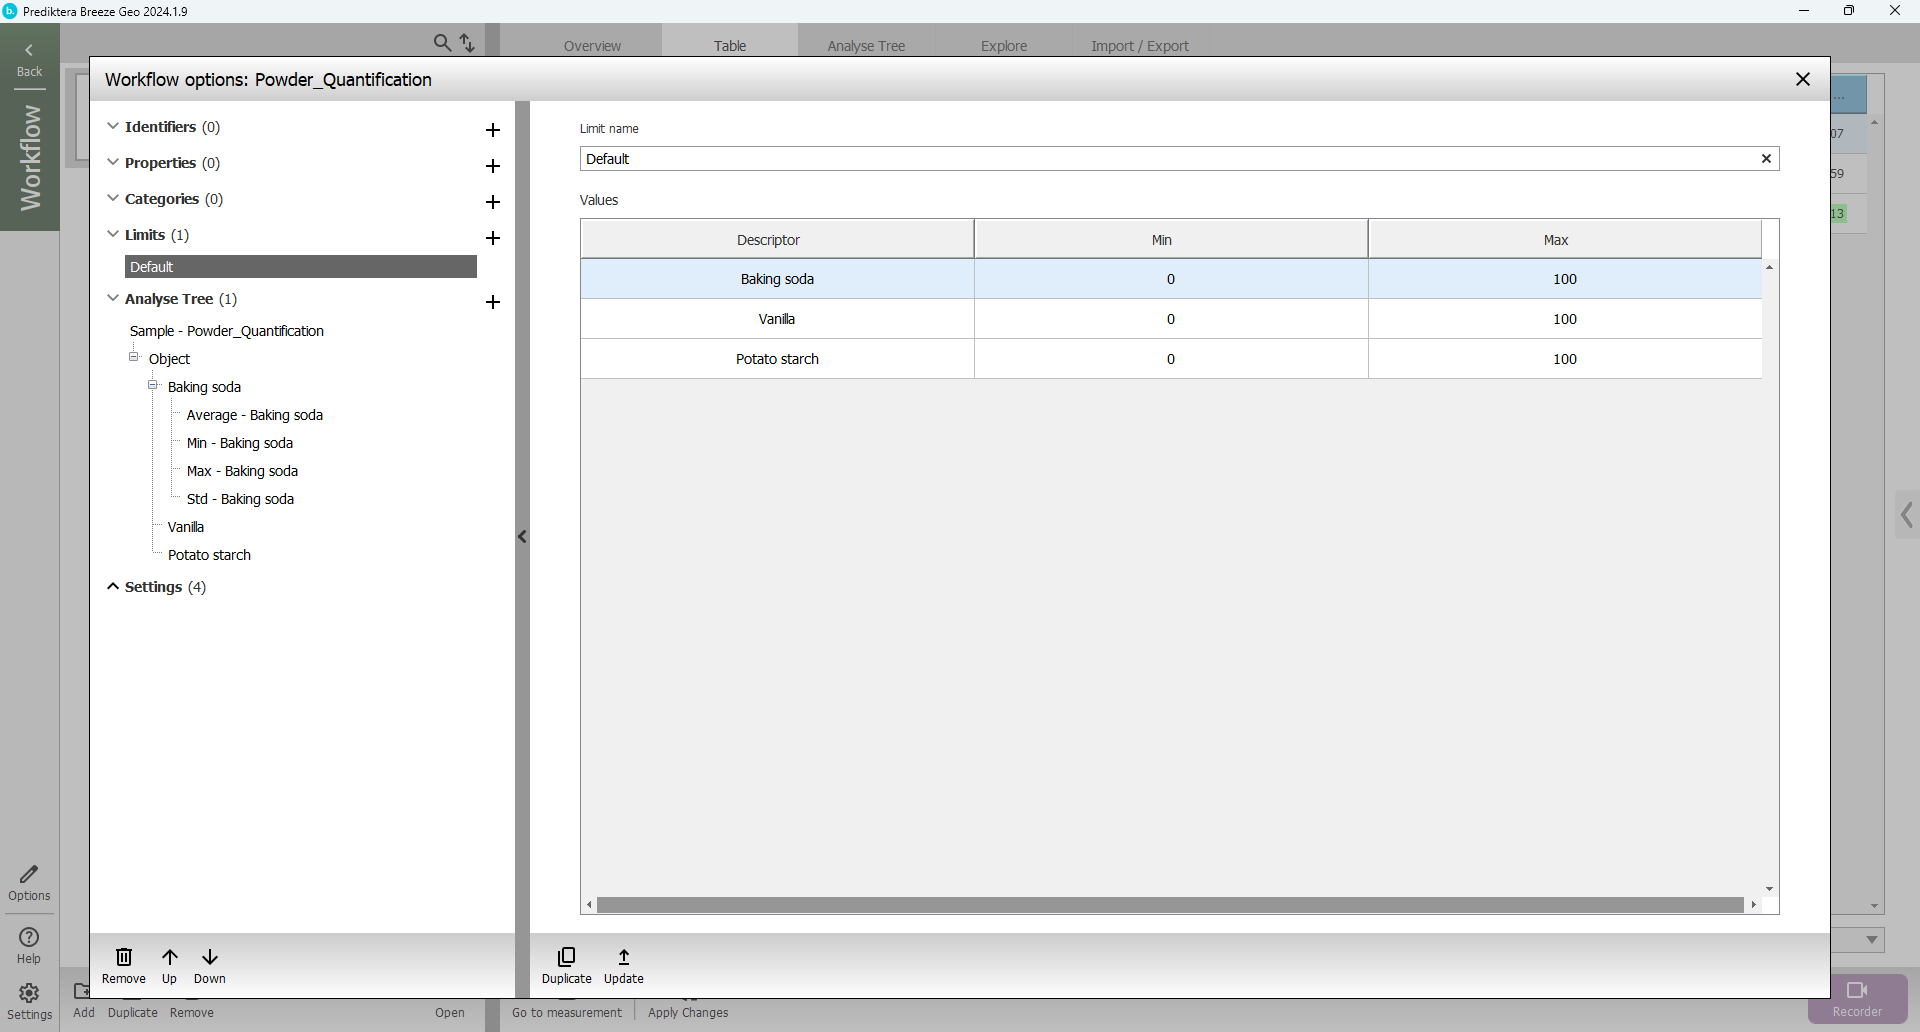
-
Duplicate the default limit

-
Change the “Limit name” to “Low” and press enter on your keyboard
Select all three rows and right-click on the Max column
Enter value 50 for Max column and press enter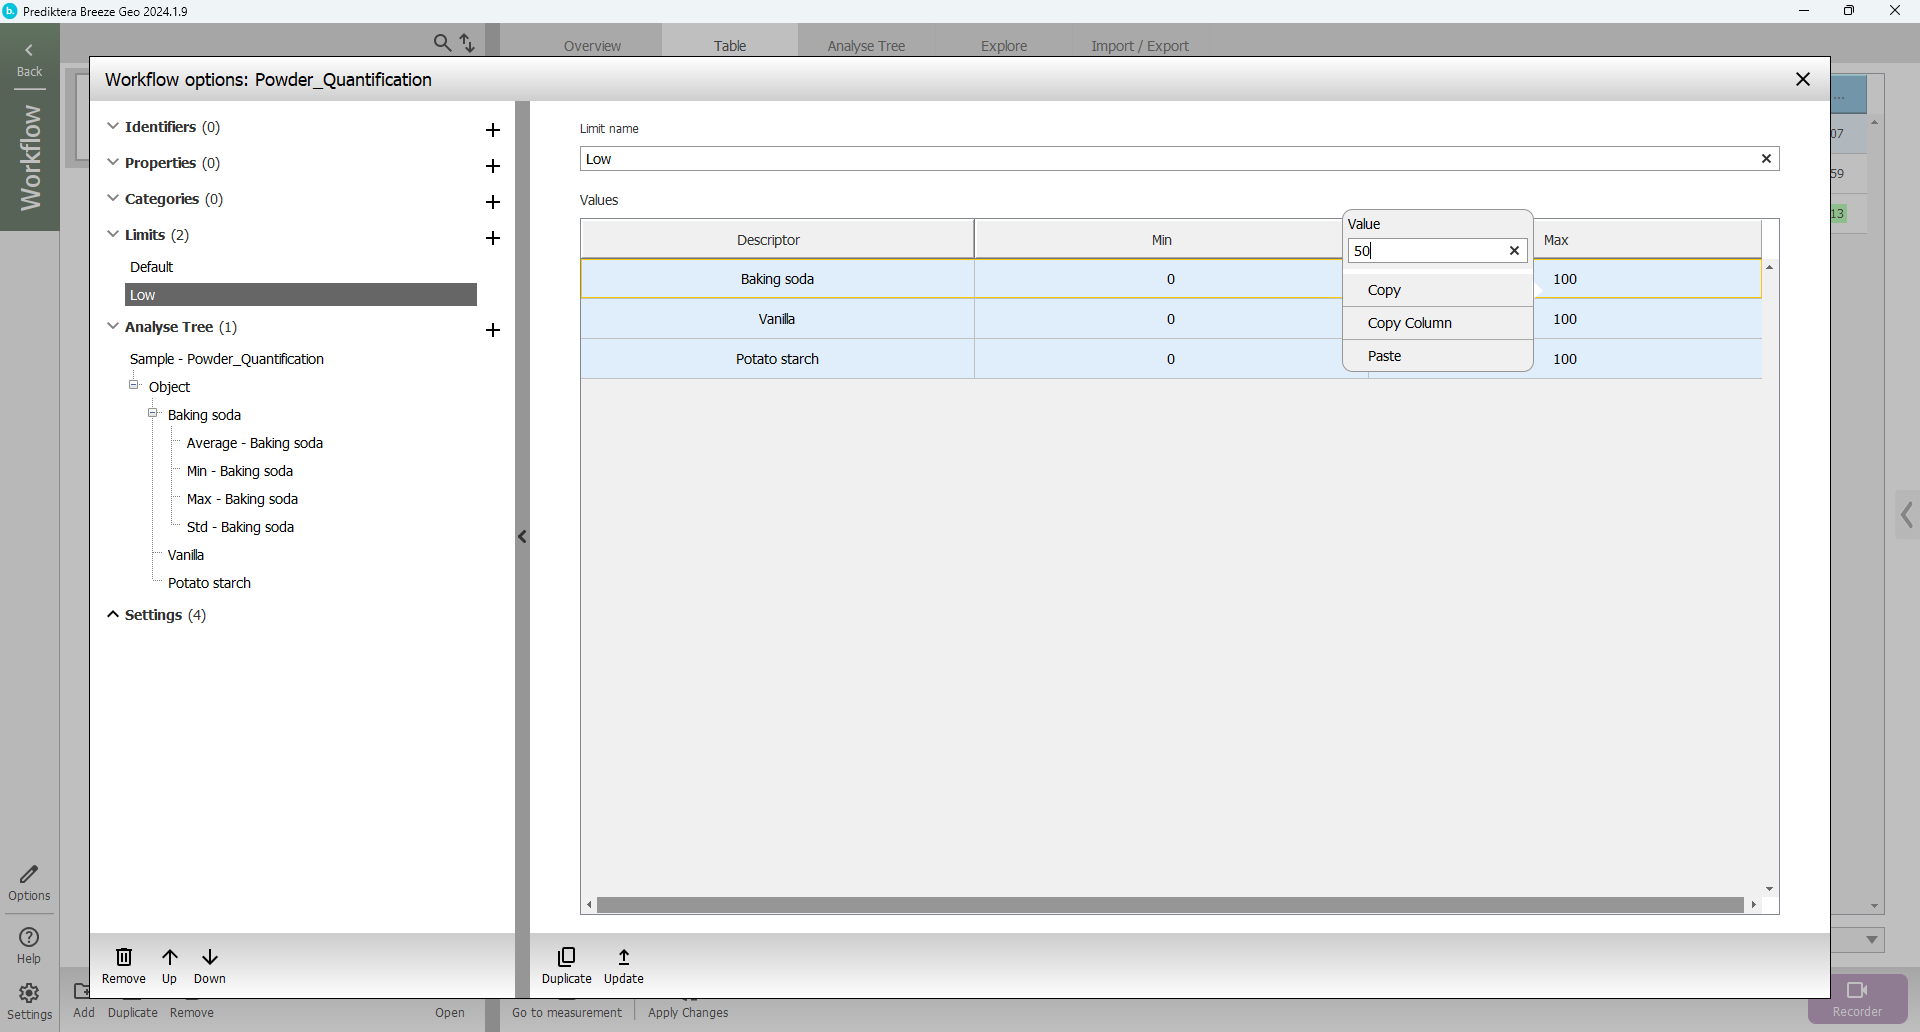
-
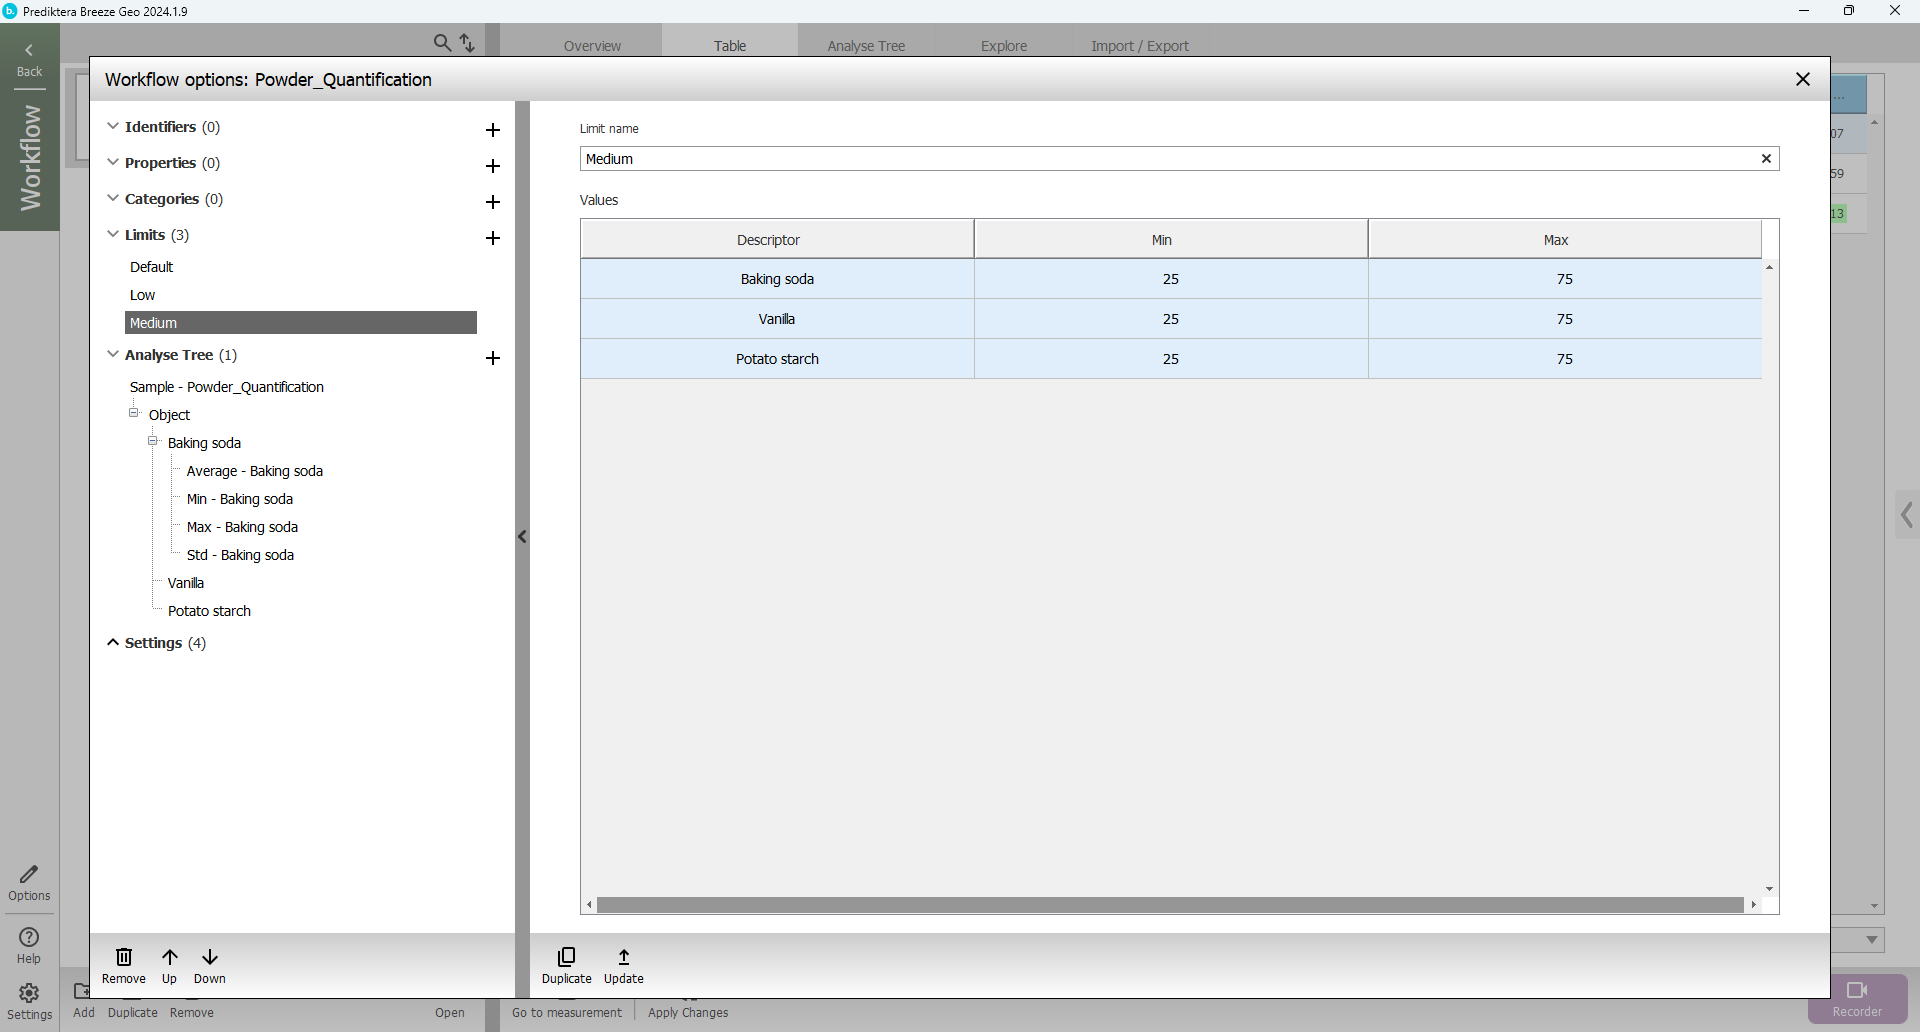
Duplicate the limit
-
Change the “Limit name” to “Medium”
Enter value 25 for the “Min” column
Enter value 75 for the “Max” column
-
Duplicate the limit
-
Change the “Limit name” to “High”
Enter value 50 for the “Min” column
Enter value 100 for the “Max” column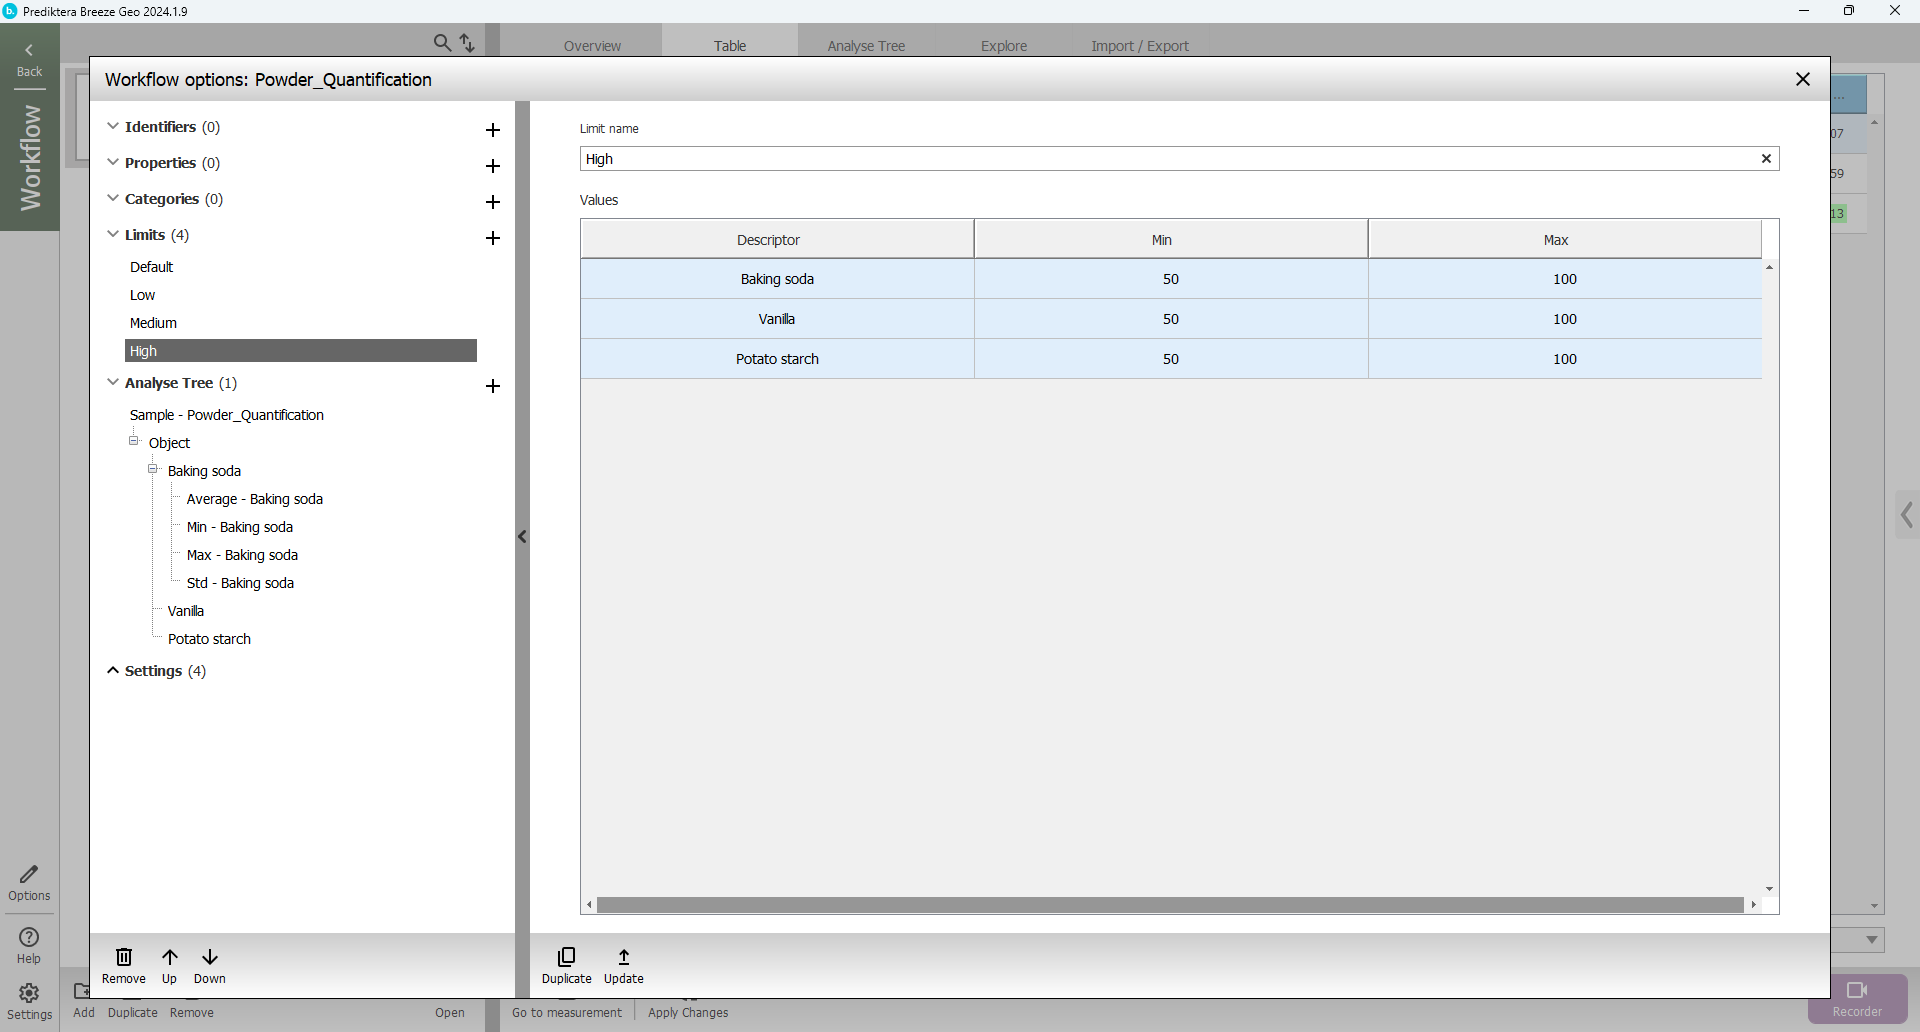
-
Close options
-
Expand the view by pressing the three dots
-
Click in the Table on the Baking soda column
Add legend by pressing the “Legend” button the measurement preview
Then change the “Limit” from “Default” to “Low”
Click in the Table to look at the image with the new limits for Baking Soda, Vanilla, and Potato Starch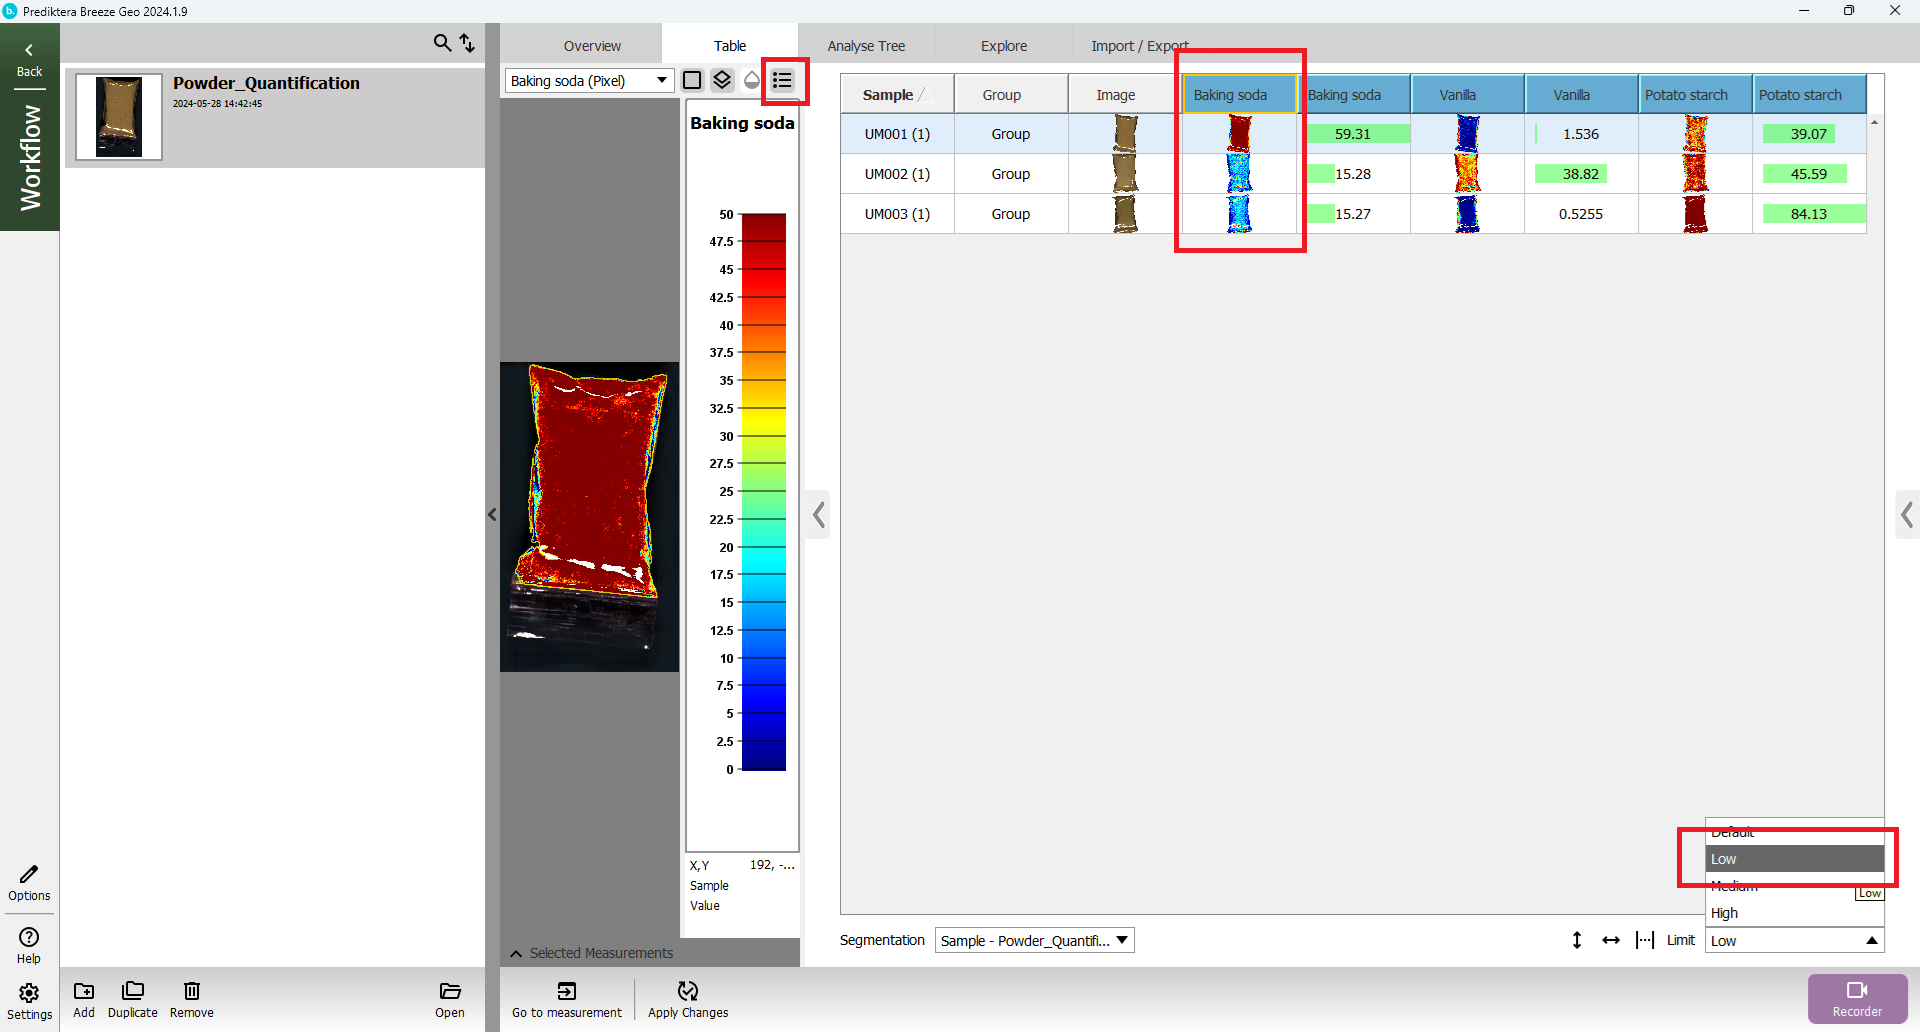
-
You can now try to change the limit to “Medium” and “High” and see the different visualization results.
The limit also changed the “Min” and “Max” values for the legend