This guide will show you how to create a workflow with different descriptors and limits. Descriptors are parameters that can be calculated for the prediction of image data. These can be calculated using a model that you have trained, i.e. quantification or classification models. They can also be calculated using spatial features (shape, size) of the objects in your image. All the available descriptors can be seen in the Descriptors space.
To follow the examples below it’s recommended to first go through: Quantification of powder samples and https://prediktera.atlassian.net/wiki/pages/resumedraft.action?draftId=564199756
To learn about making Segmentation read: Segmentation guide
General instructions - Views for setting up your descriptors
Edit workflow
One view is opened by pressing the “Edit” button for your Workflow.
This view will be shown in all the examples in this user guide.

Analyse Tree
The other view is to open the “Analyse Tree” tab. Here you have a graphical presentation of the different steps in your workflow. By clicking on a node in your tree, you can change the settings for it in the menu on the right. Under the picture of the tree you there is a menu to add, move or remove nodes.

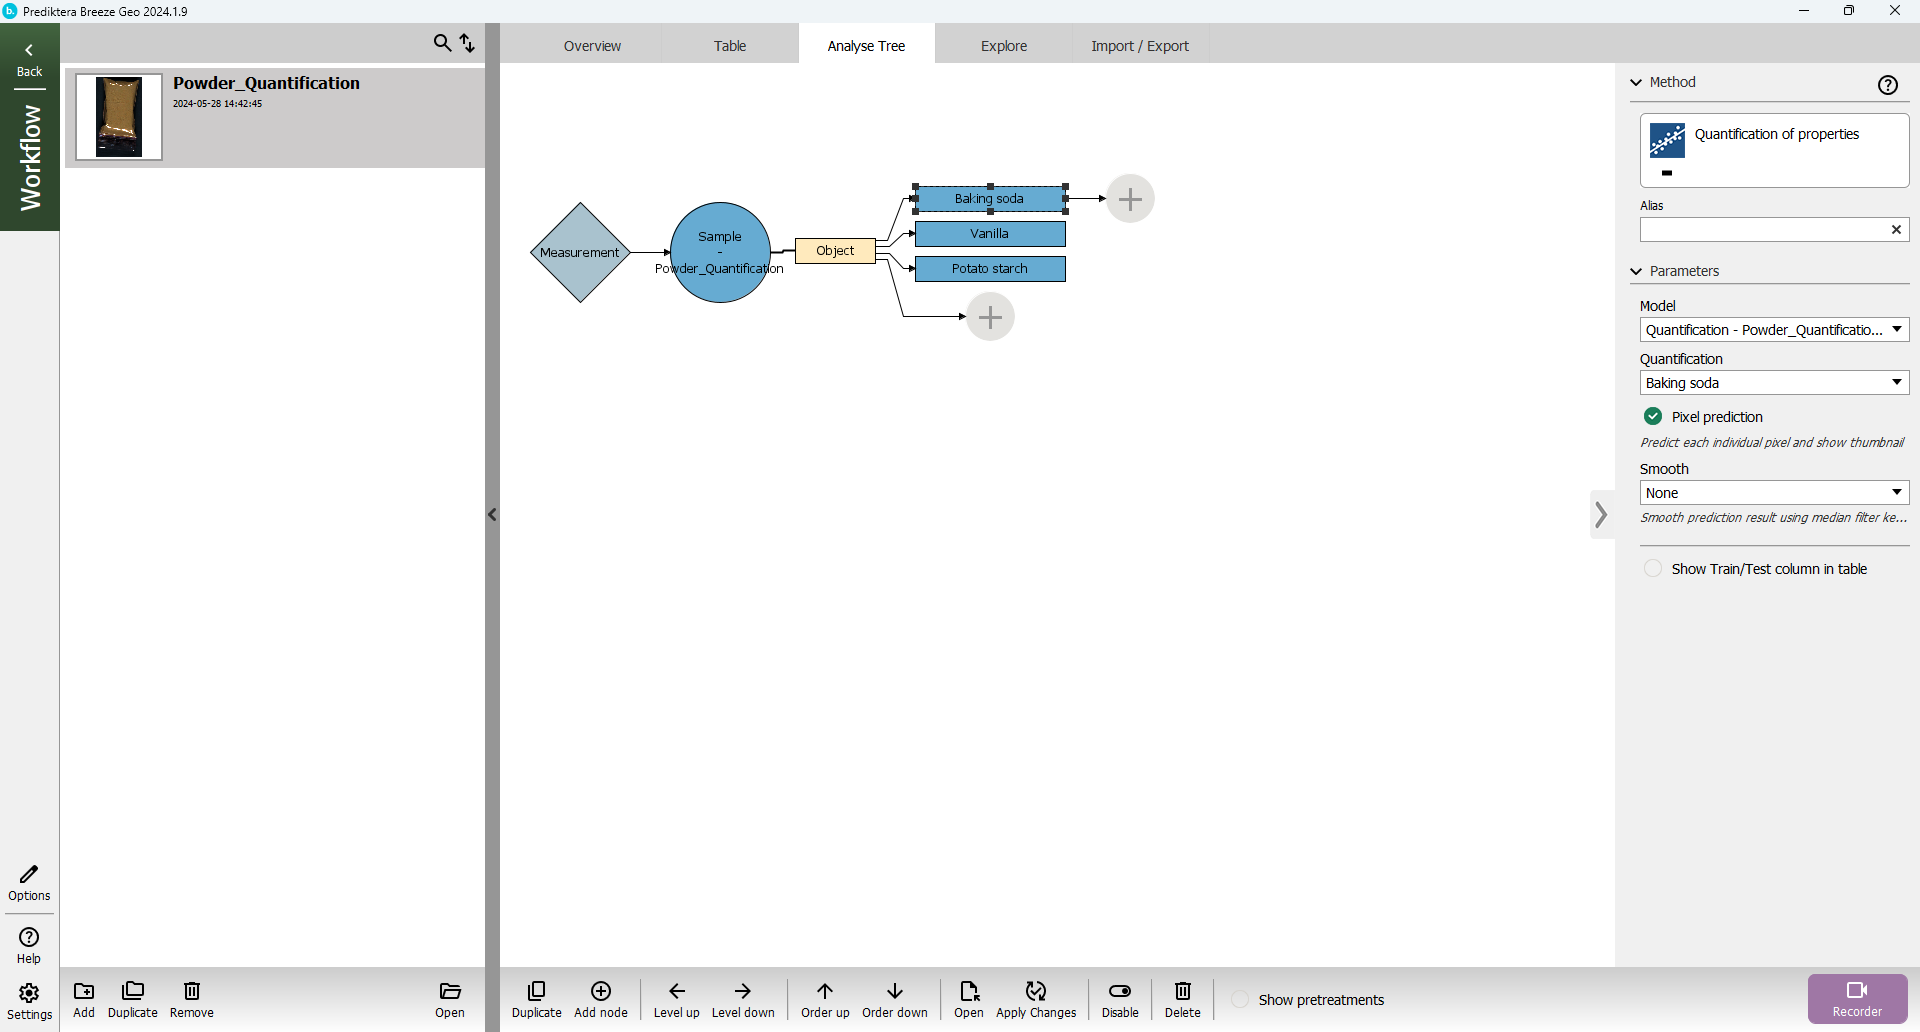
Workflow example with Powder Quantification image data
This section starts after creating a new Workflow with Record data using the Group “Unknown Mix” from Powder Quantification.
Select Baking Soda in the “Analyse Tree”:
Press “Add node” button

Select “Descriptor” and choose “Statistics of pixels (properties)”.
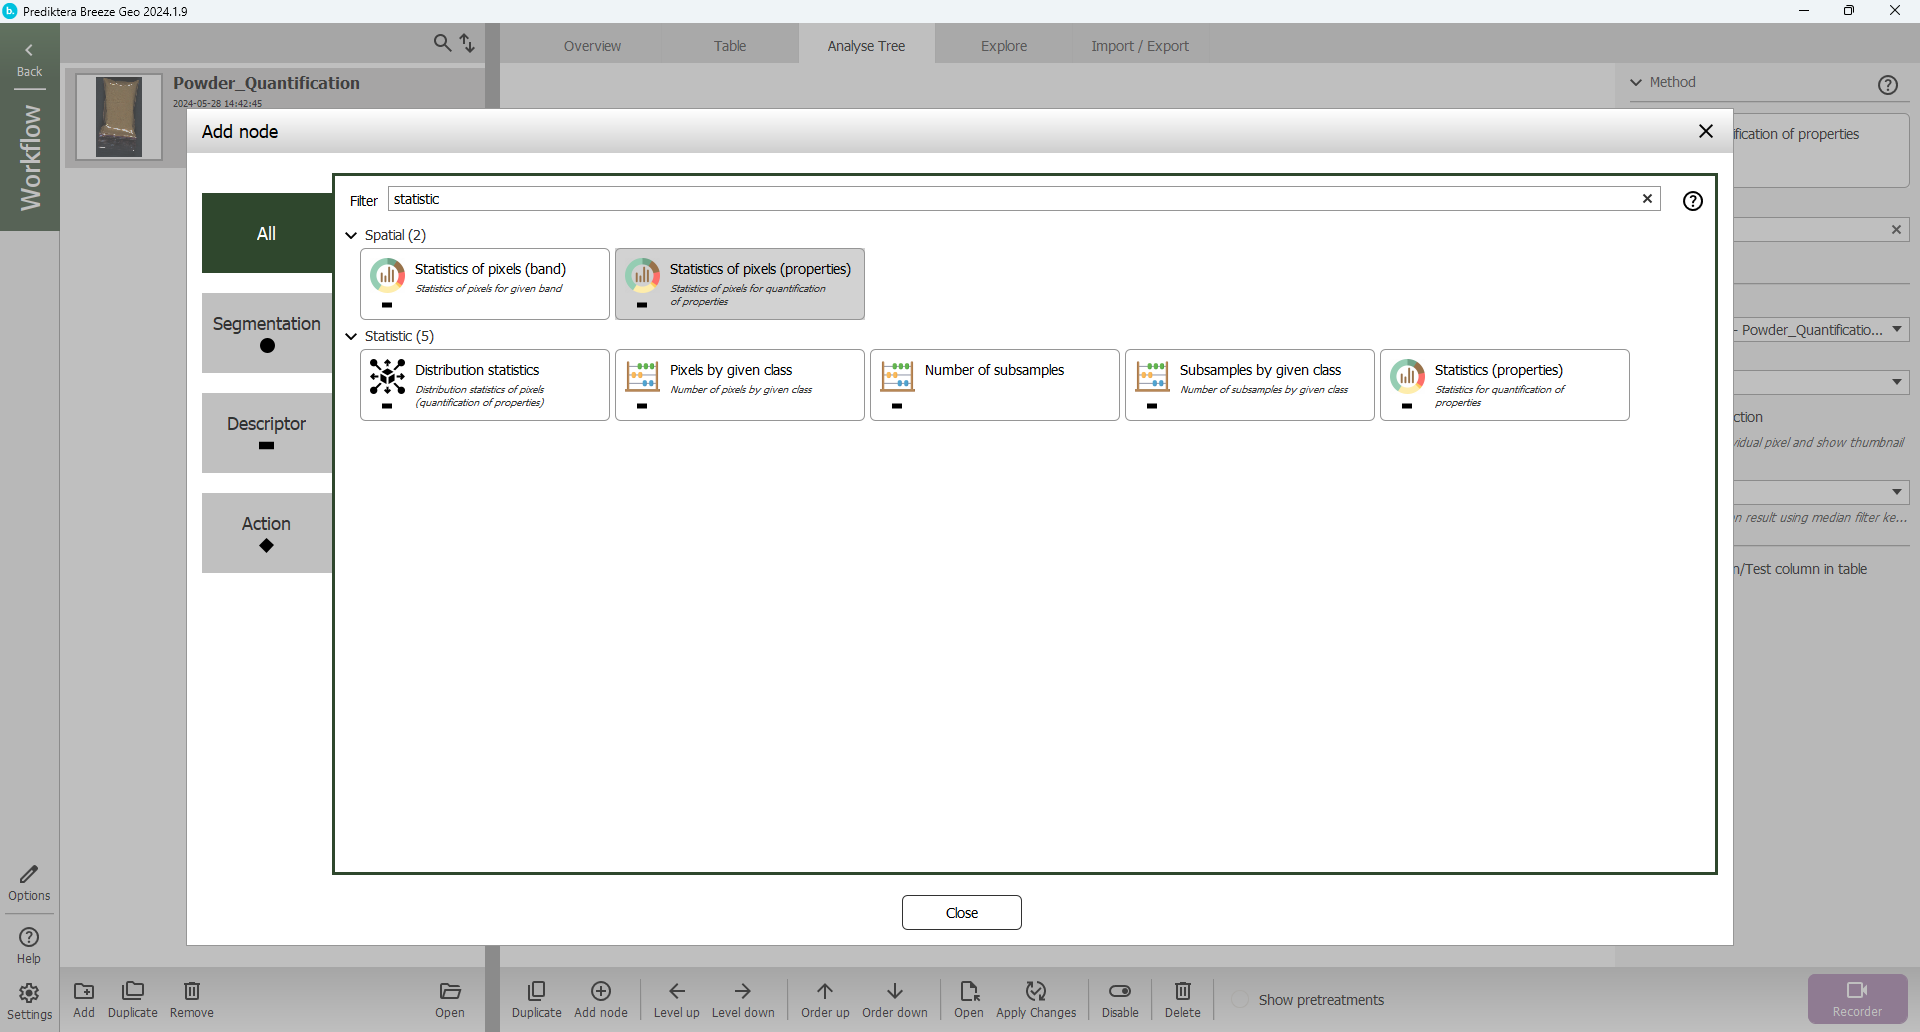
You have now added “Average”.
Duplicate the descriptor three times.
Change the output to Min, Max, and Std as shown below
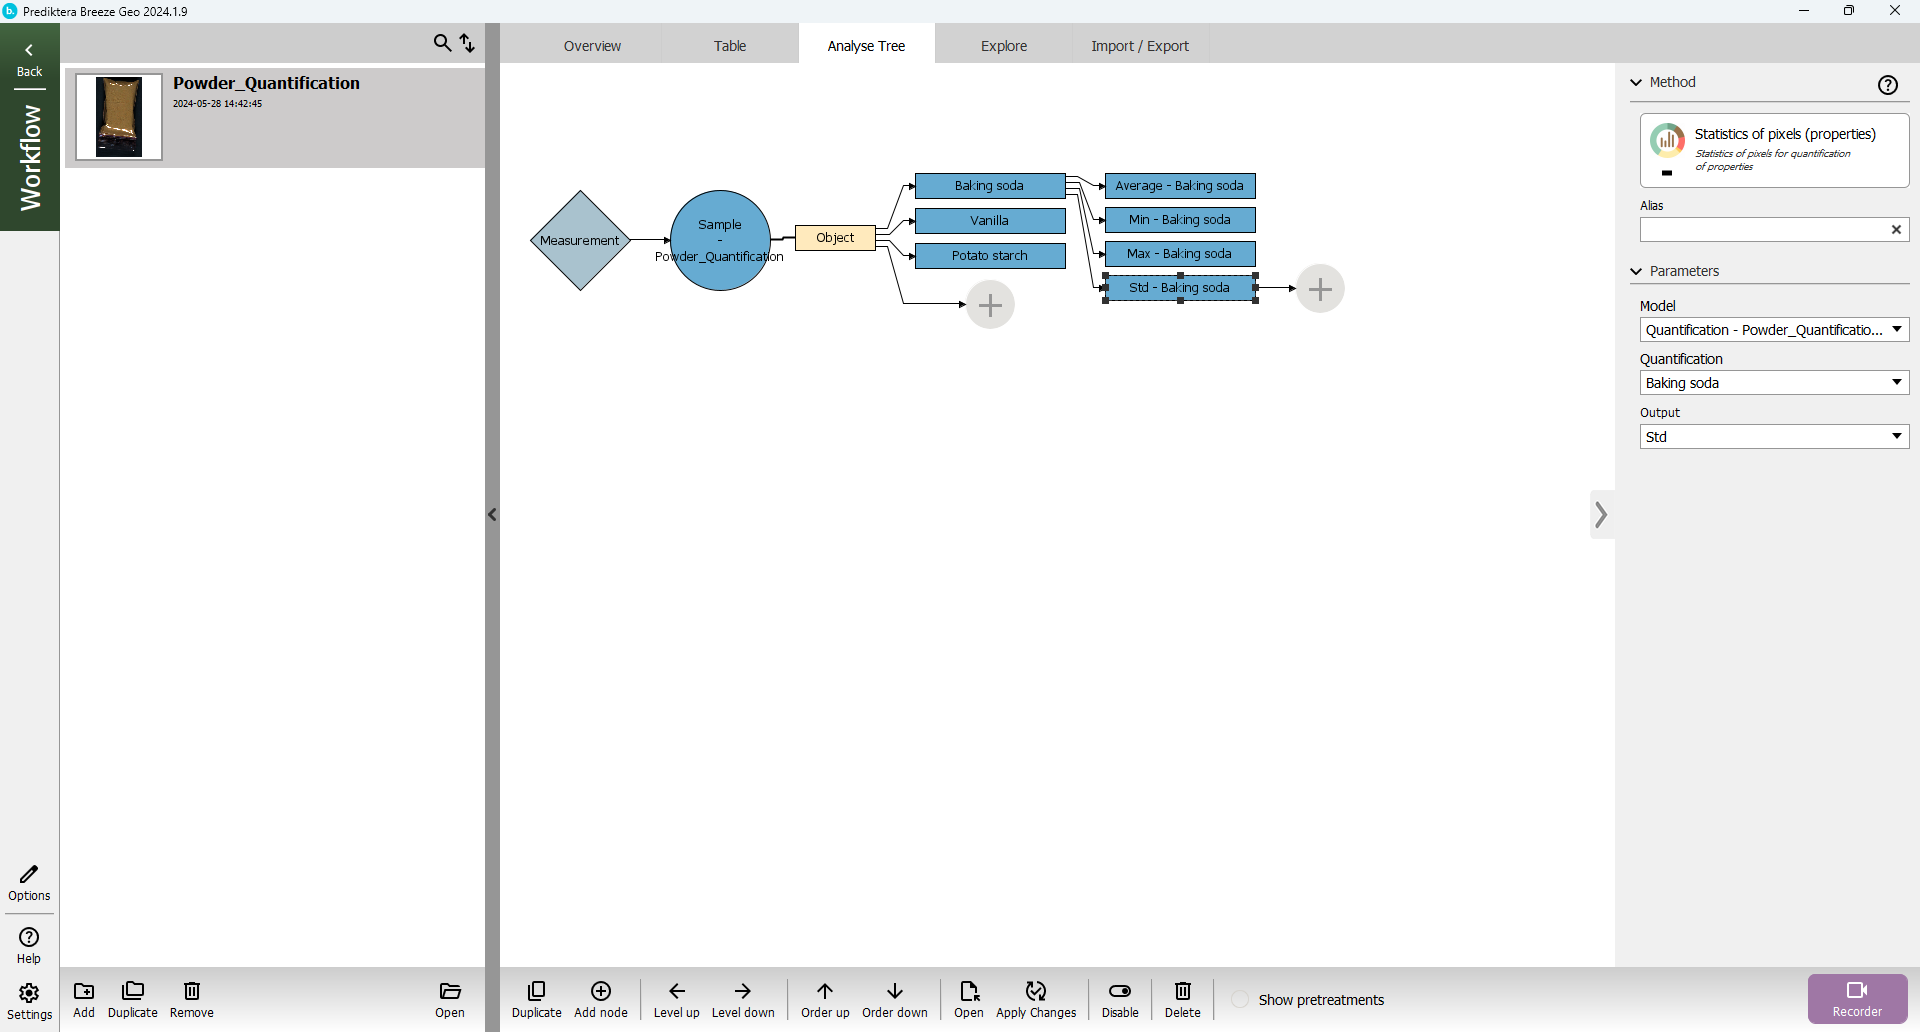
Press “Apply Changes” and go back to “Table”.

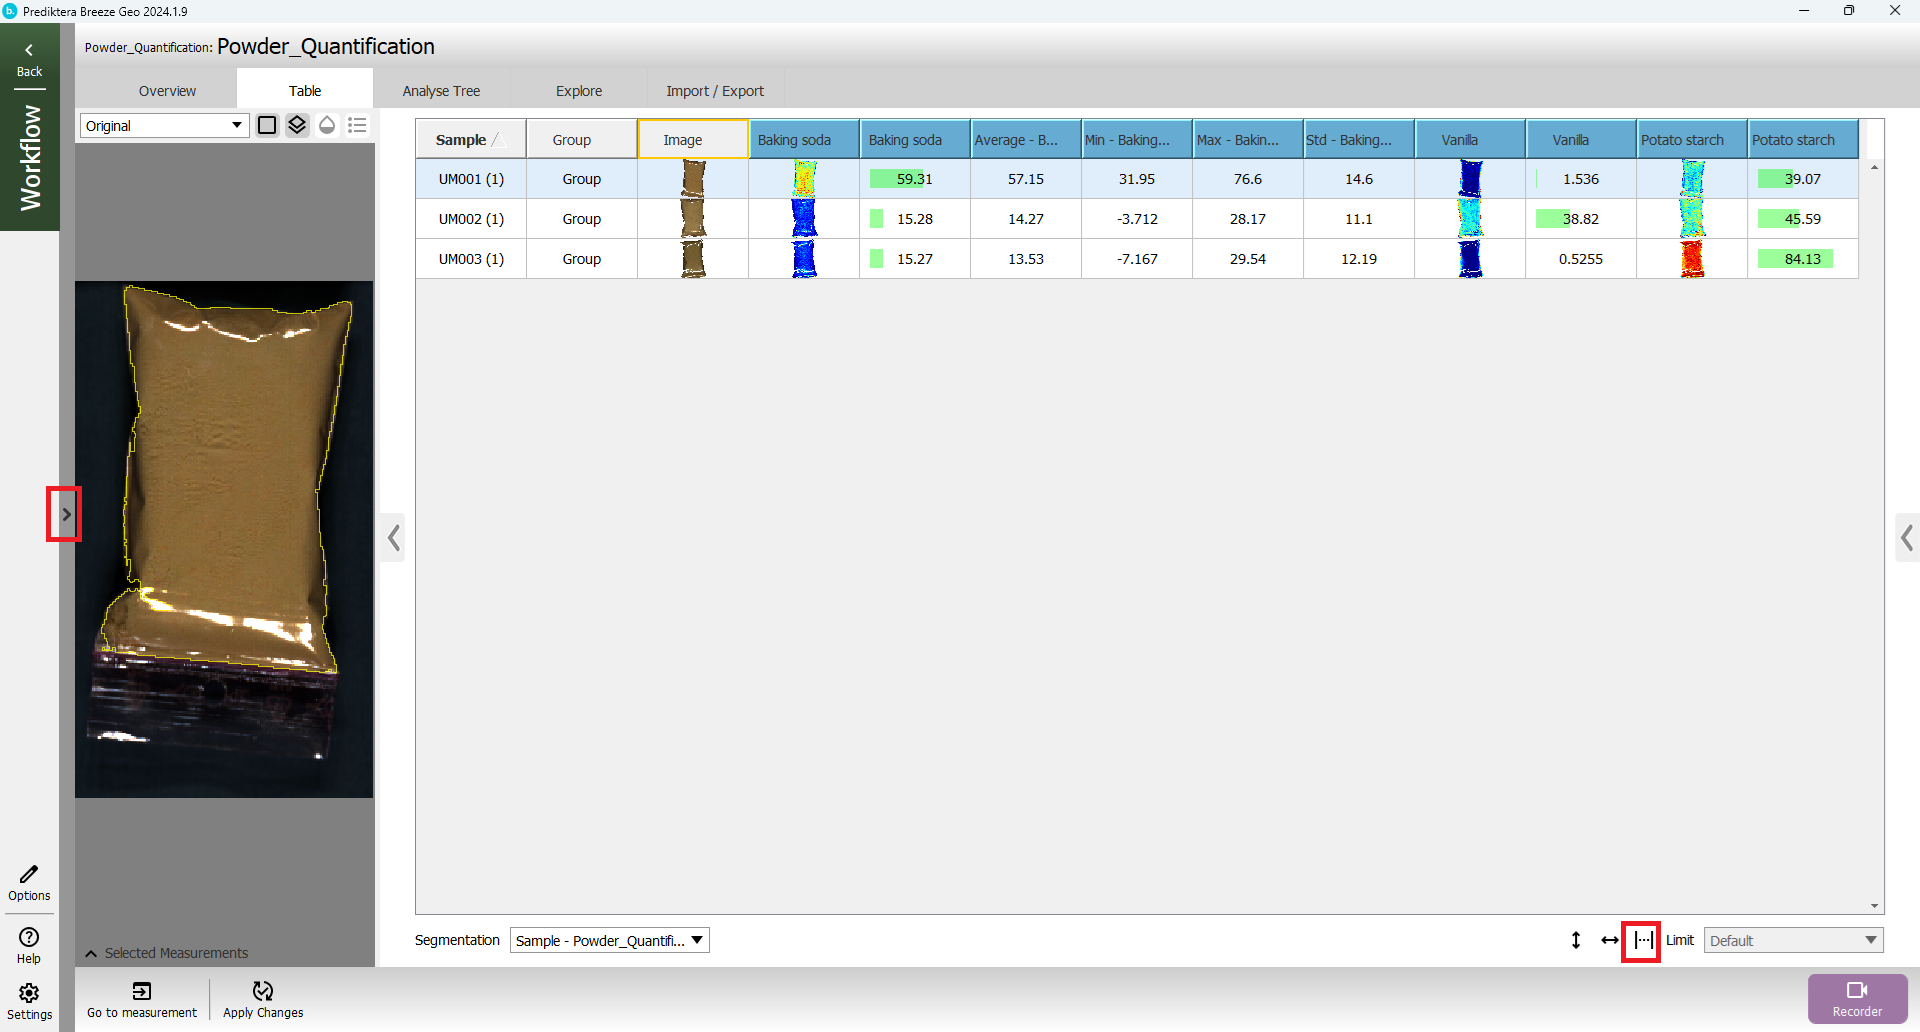
Hide the measurement preview and change the width of the table by pressing “Table auto fit” in the bottom right of the window.
The view should look like this width the added descriptors in the table:
Workflow example with Nuts Classification image data
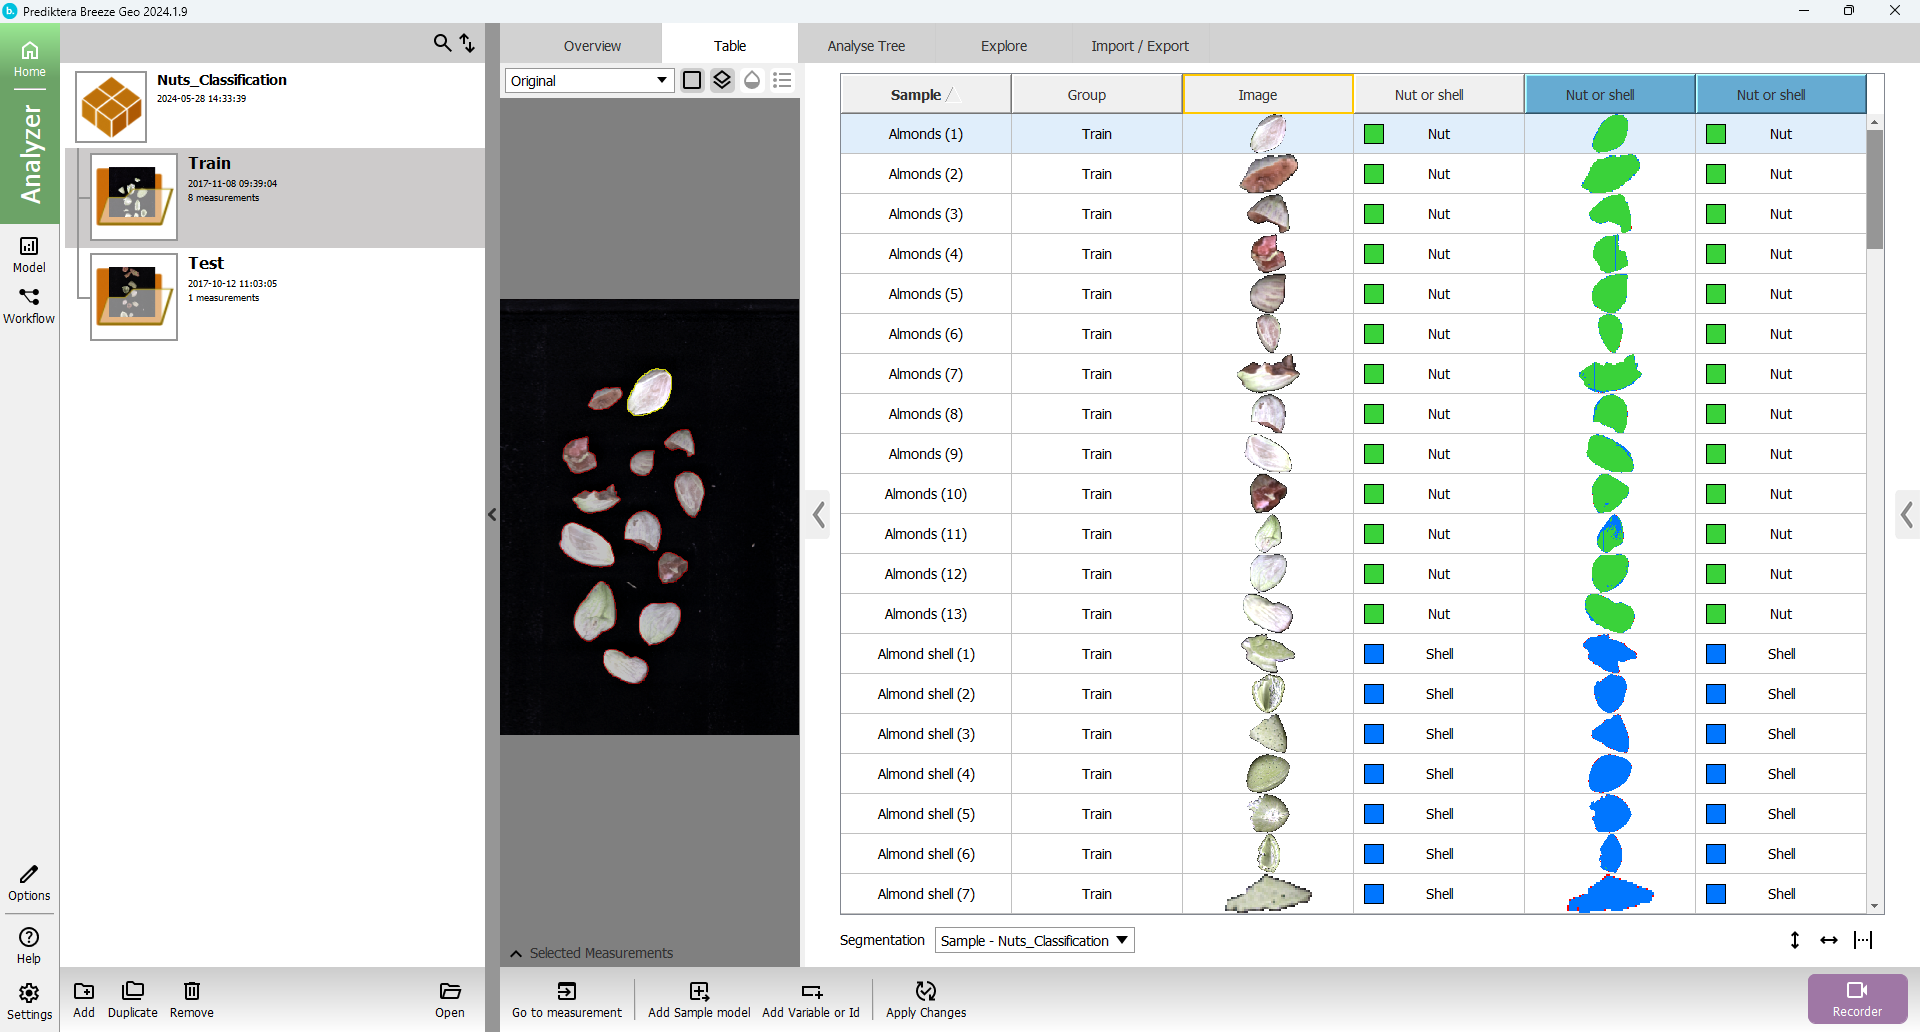
This section starts after creating a new Workflow with Record data using the Group “Test” from the “Nuts Classification” tutorial.
You should have the following view:
Press the “Analyse Tree” tab.
Add “Subsamples by given class” to the measurement node.
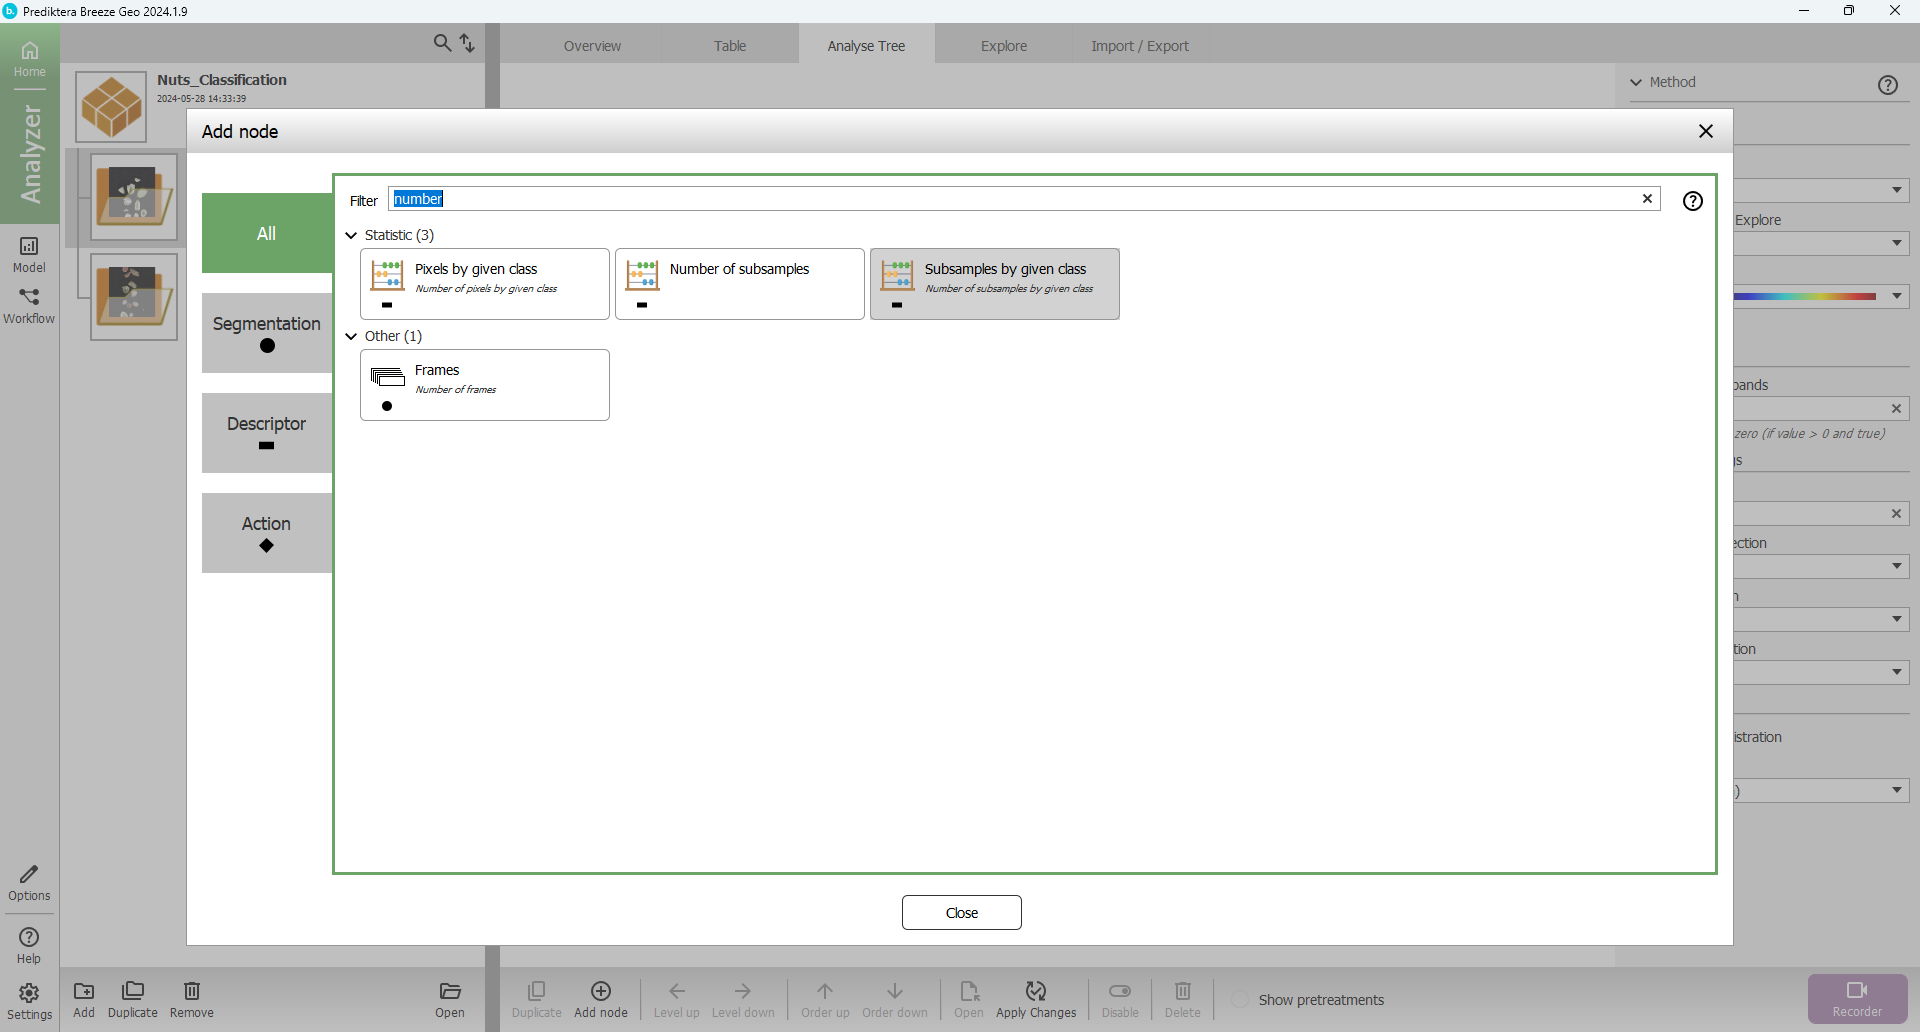
Change the “Class” parameter to “Shell”
Duplicate the descriptor.

Change the “Class parameter” to “Nut”.
Press “Apply Changes” and go to “Table” tab.

The two descriptors are added to the root level, called “Measurement”.
Change the Segmentation to “Measurement” in the drop-down
The view should look like this:
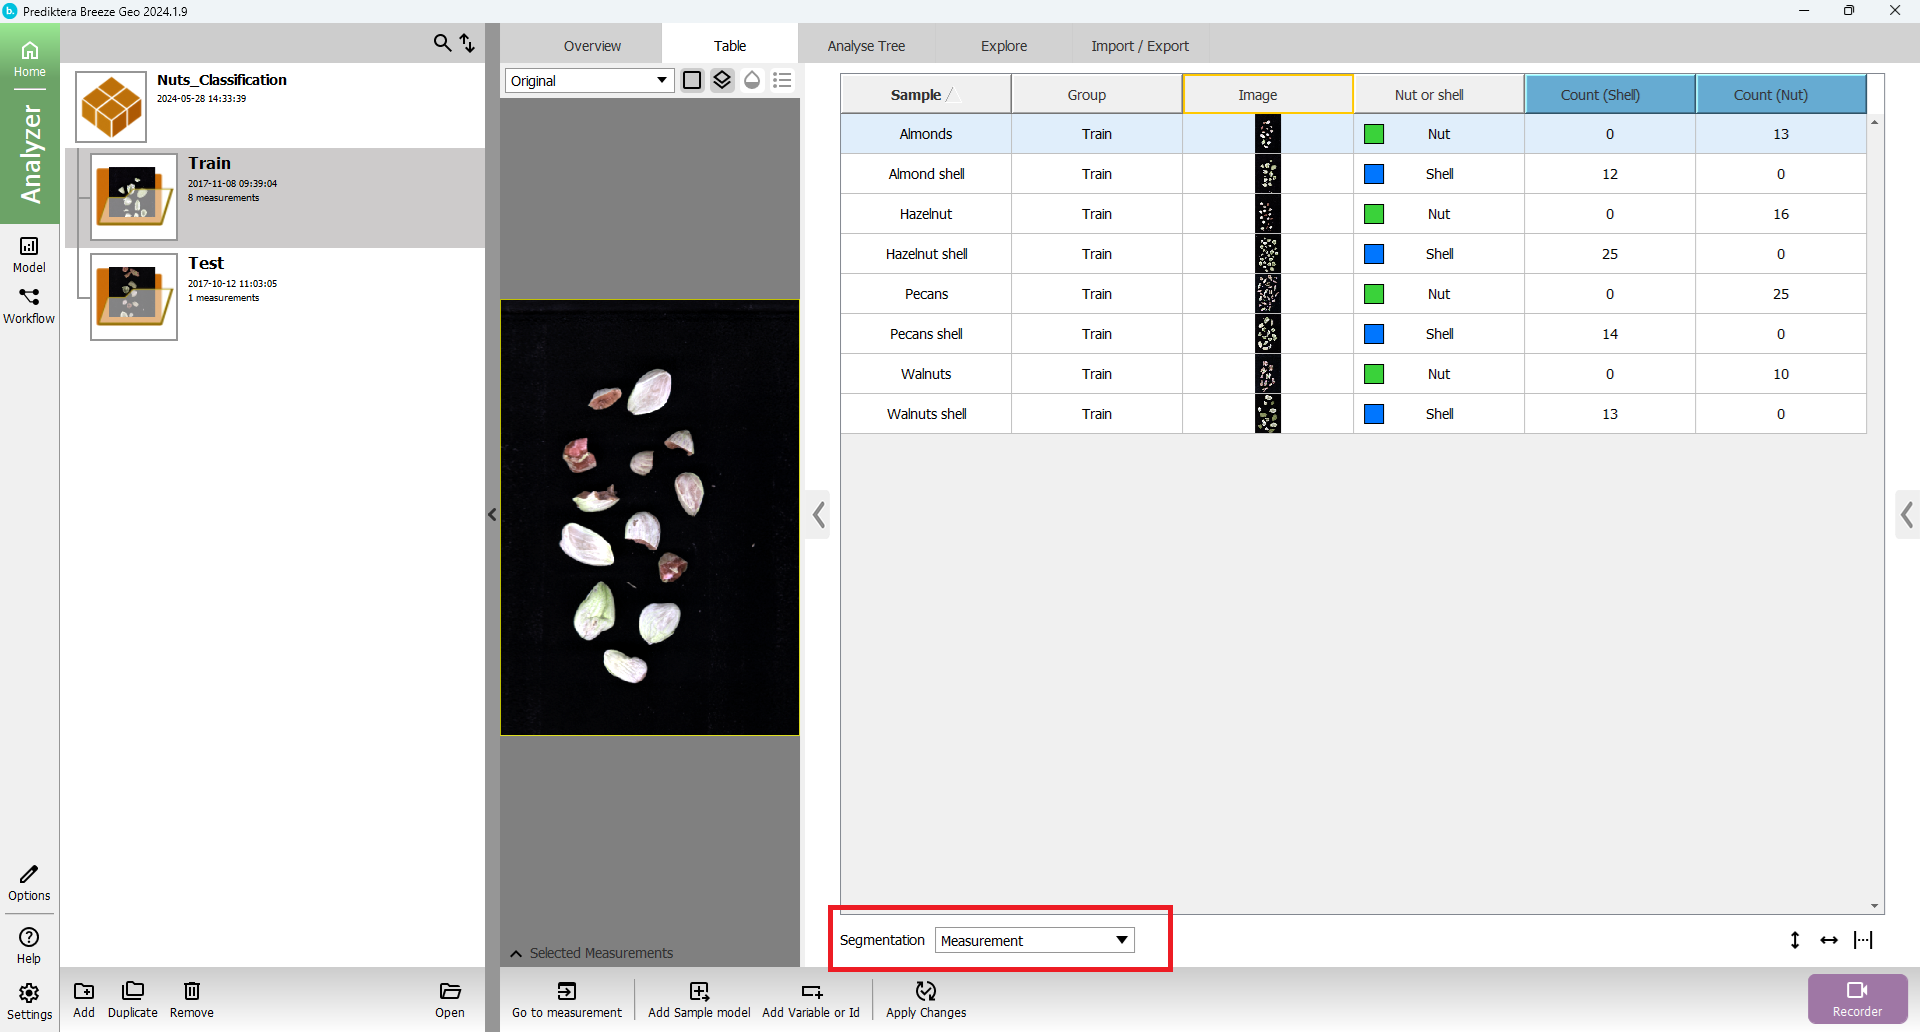
You can see the two columns in the table with the number of Shell and Nut in the measurement.
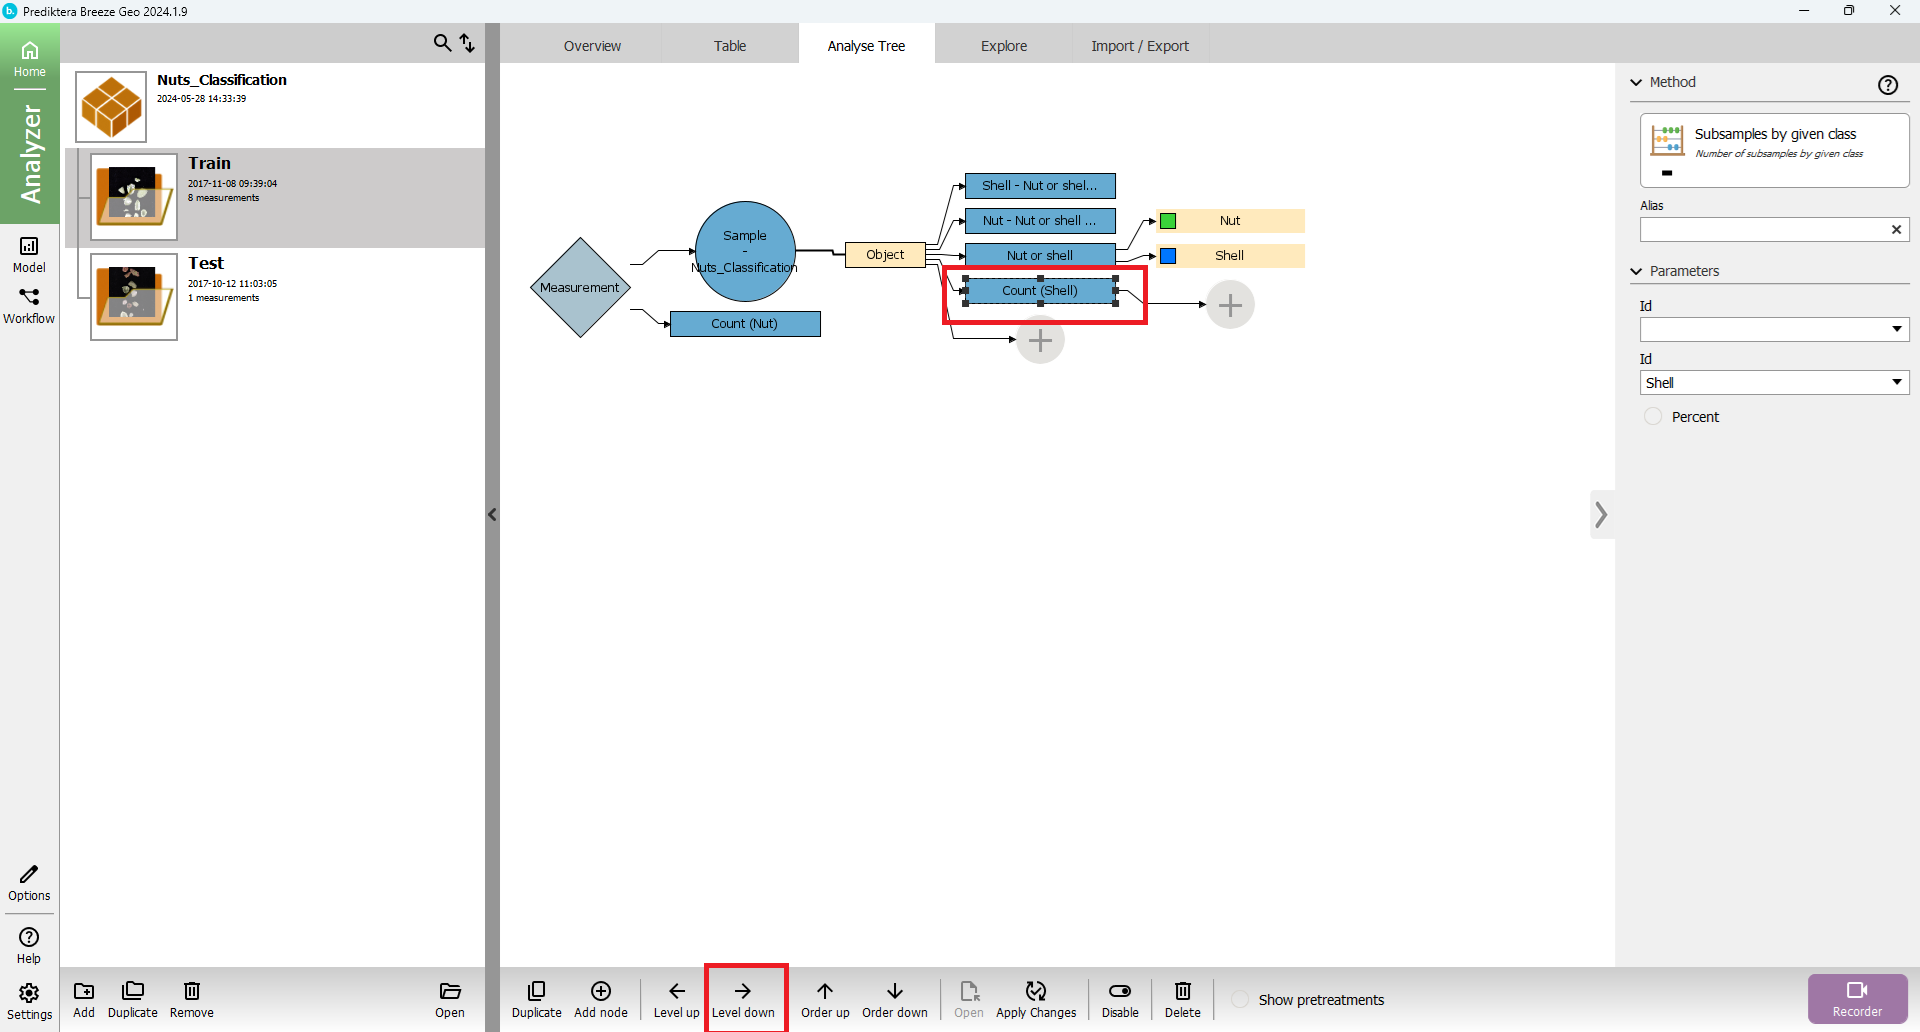
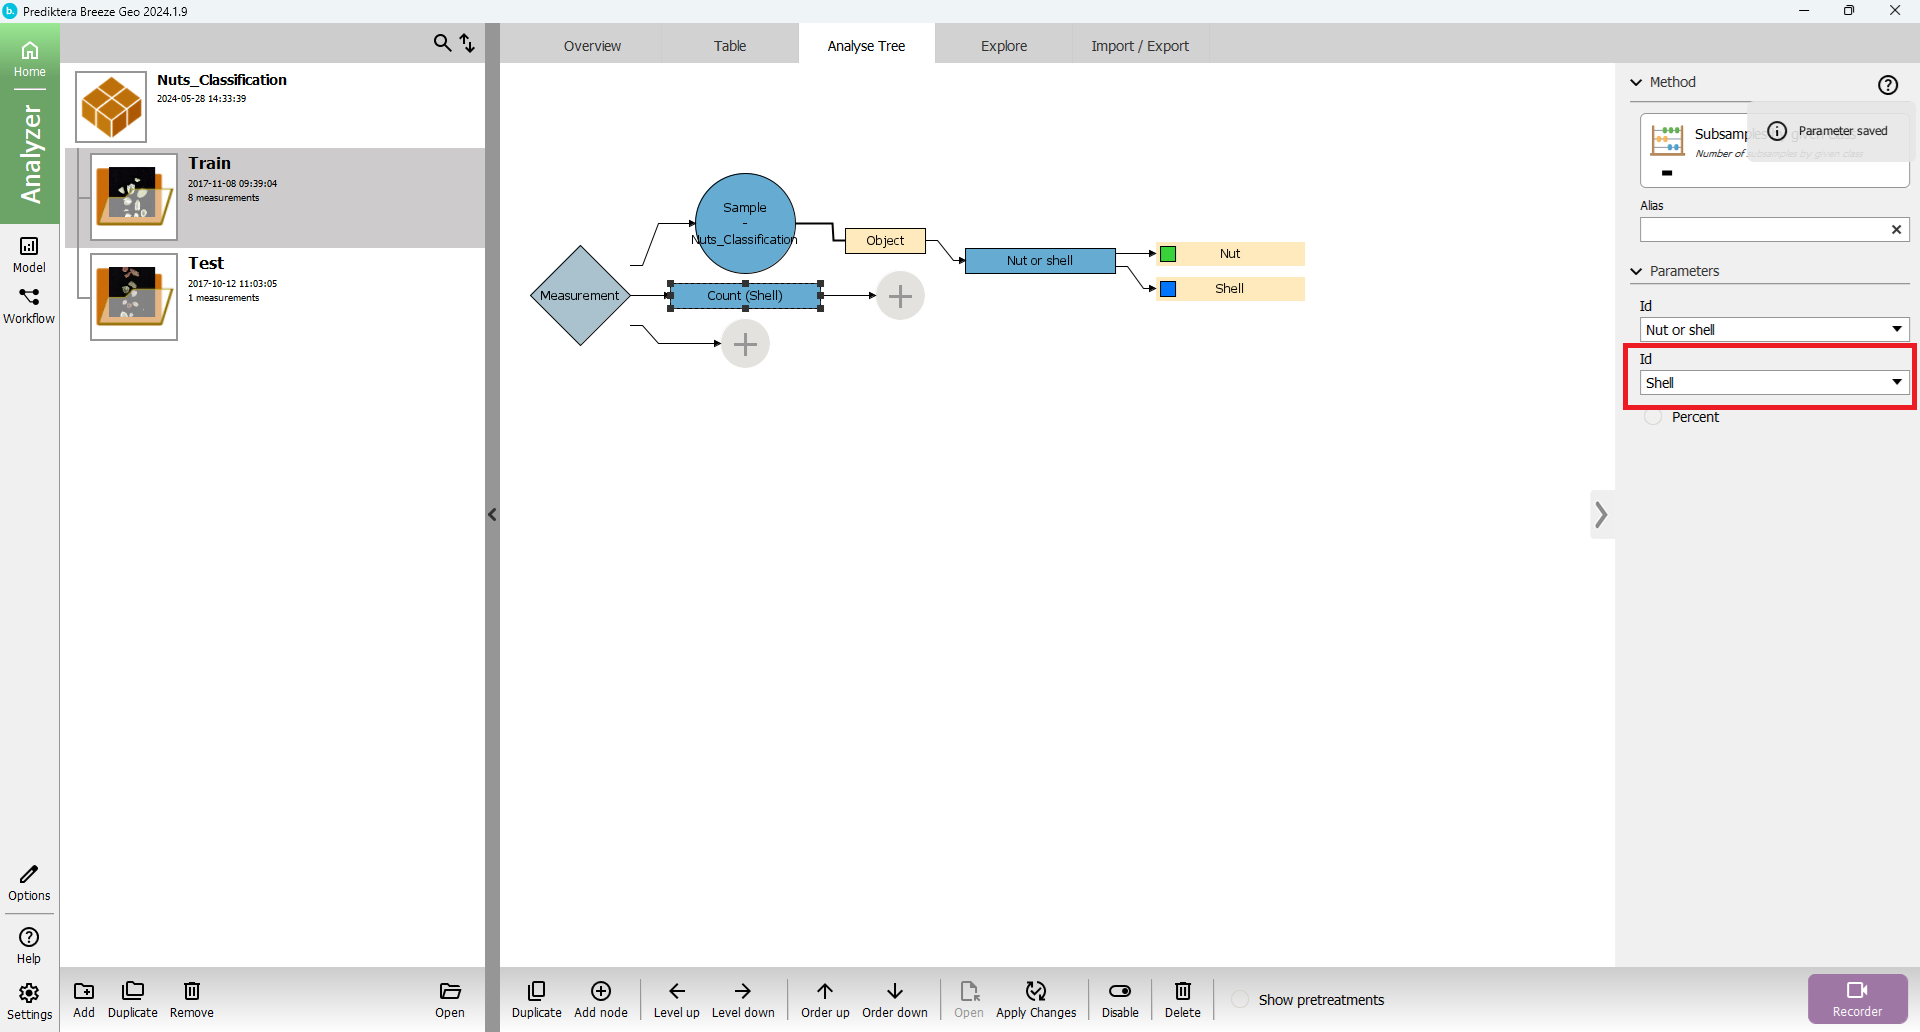
Select the “Analyse Tree” tab again.
Select “Sample model” in the tree and press “Add node”.

Change “Class” to “Shell”.
Duplicate the descriptor.
Change “Class” to “Nut” for the duplicated descriptor.
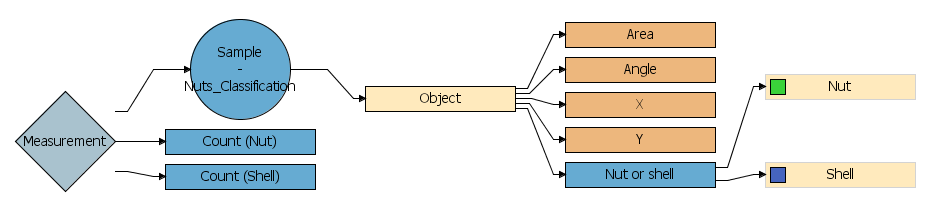
The “Analyse Tree” should look like this:
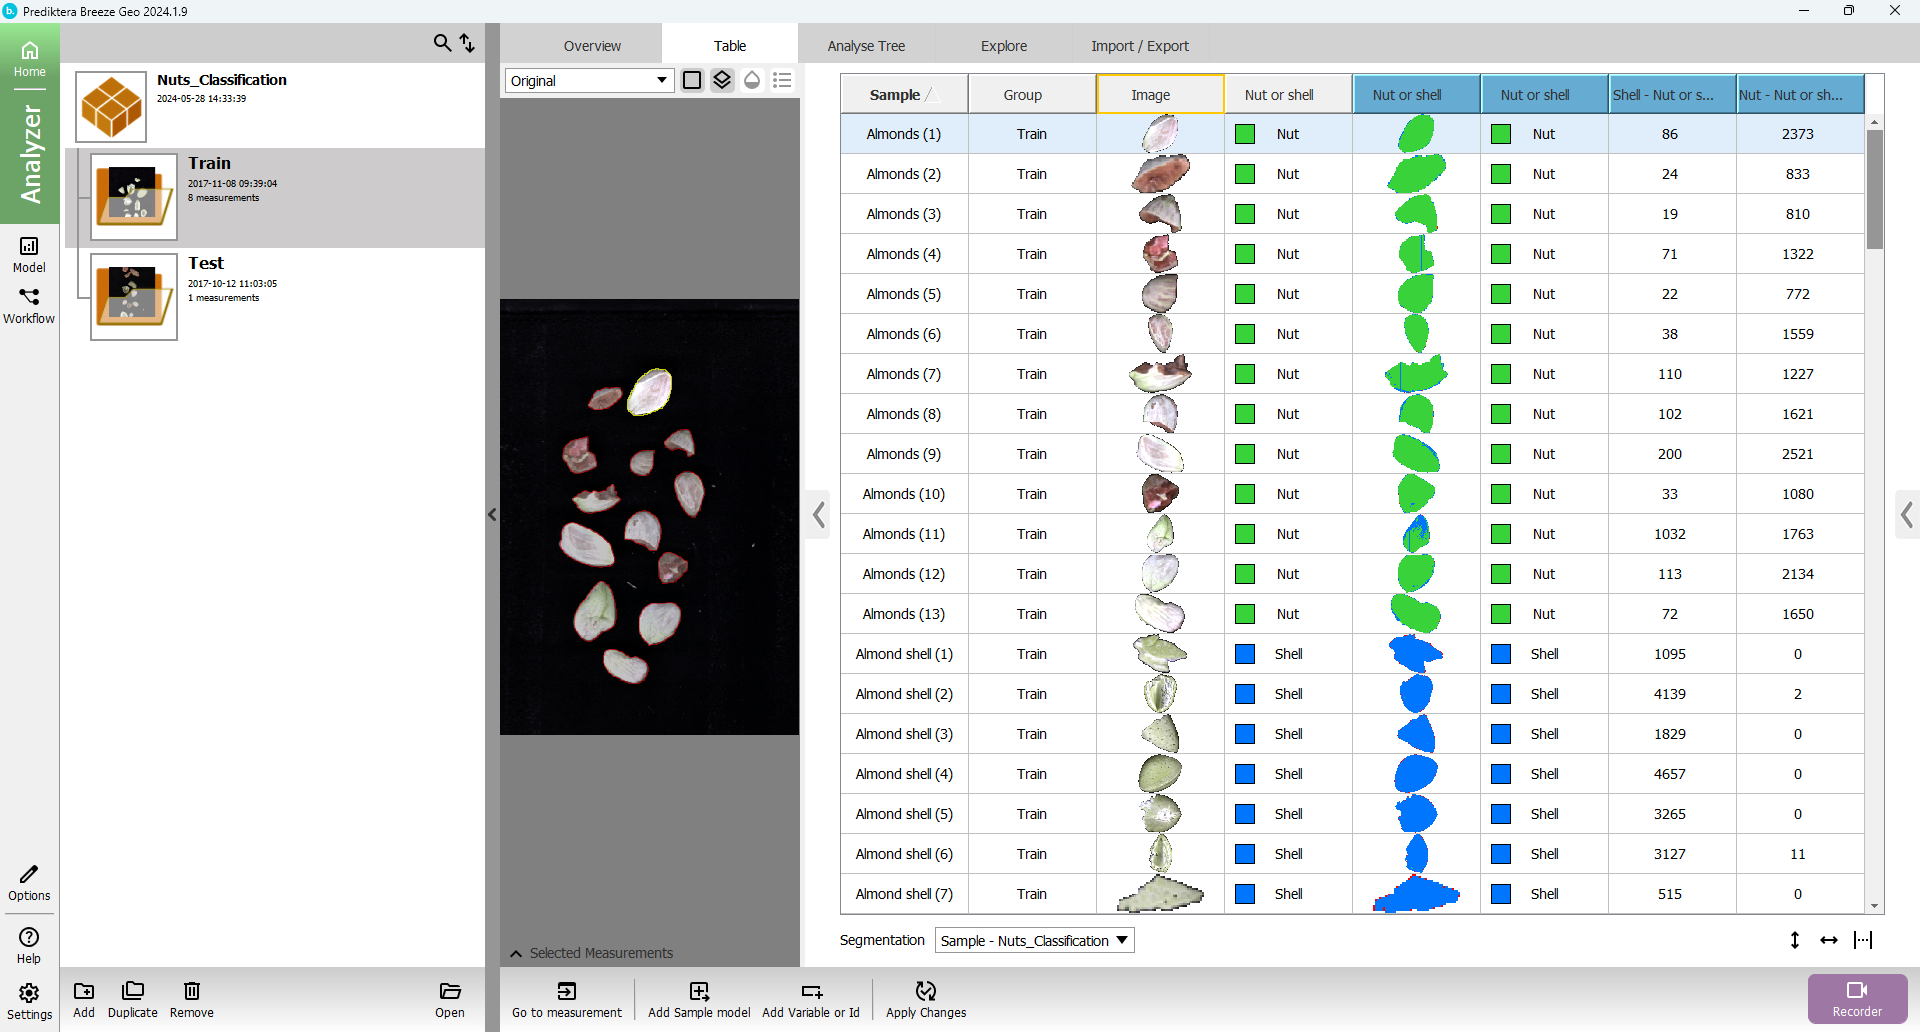
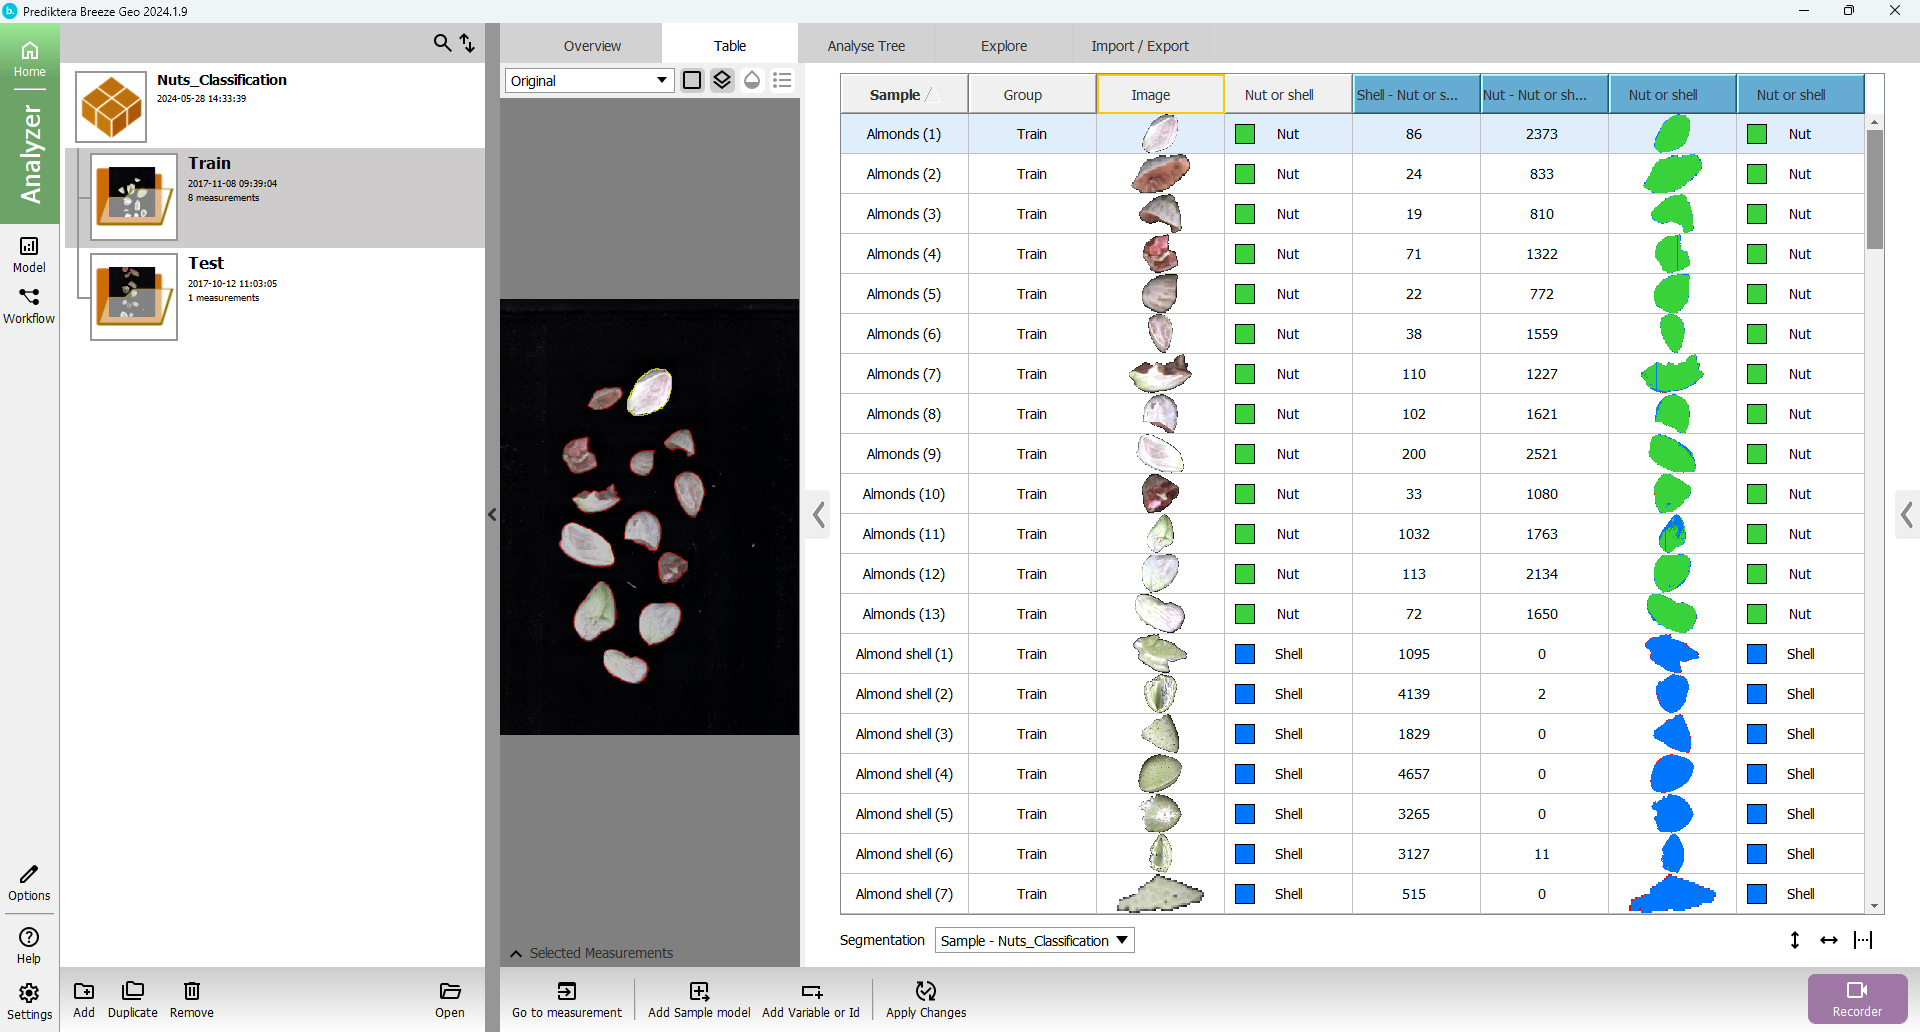
Press “Apply Changes” and go back to the “Table” tab.
The view should then look like this:
Tips and tricks
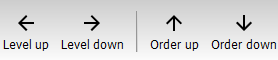
Move up and down
You can use the “Up” and “Down” buttons to move a descriptor or segmentation up or down in the analysis tree
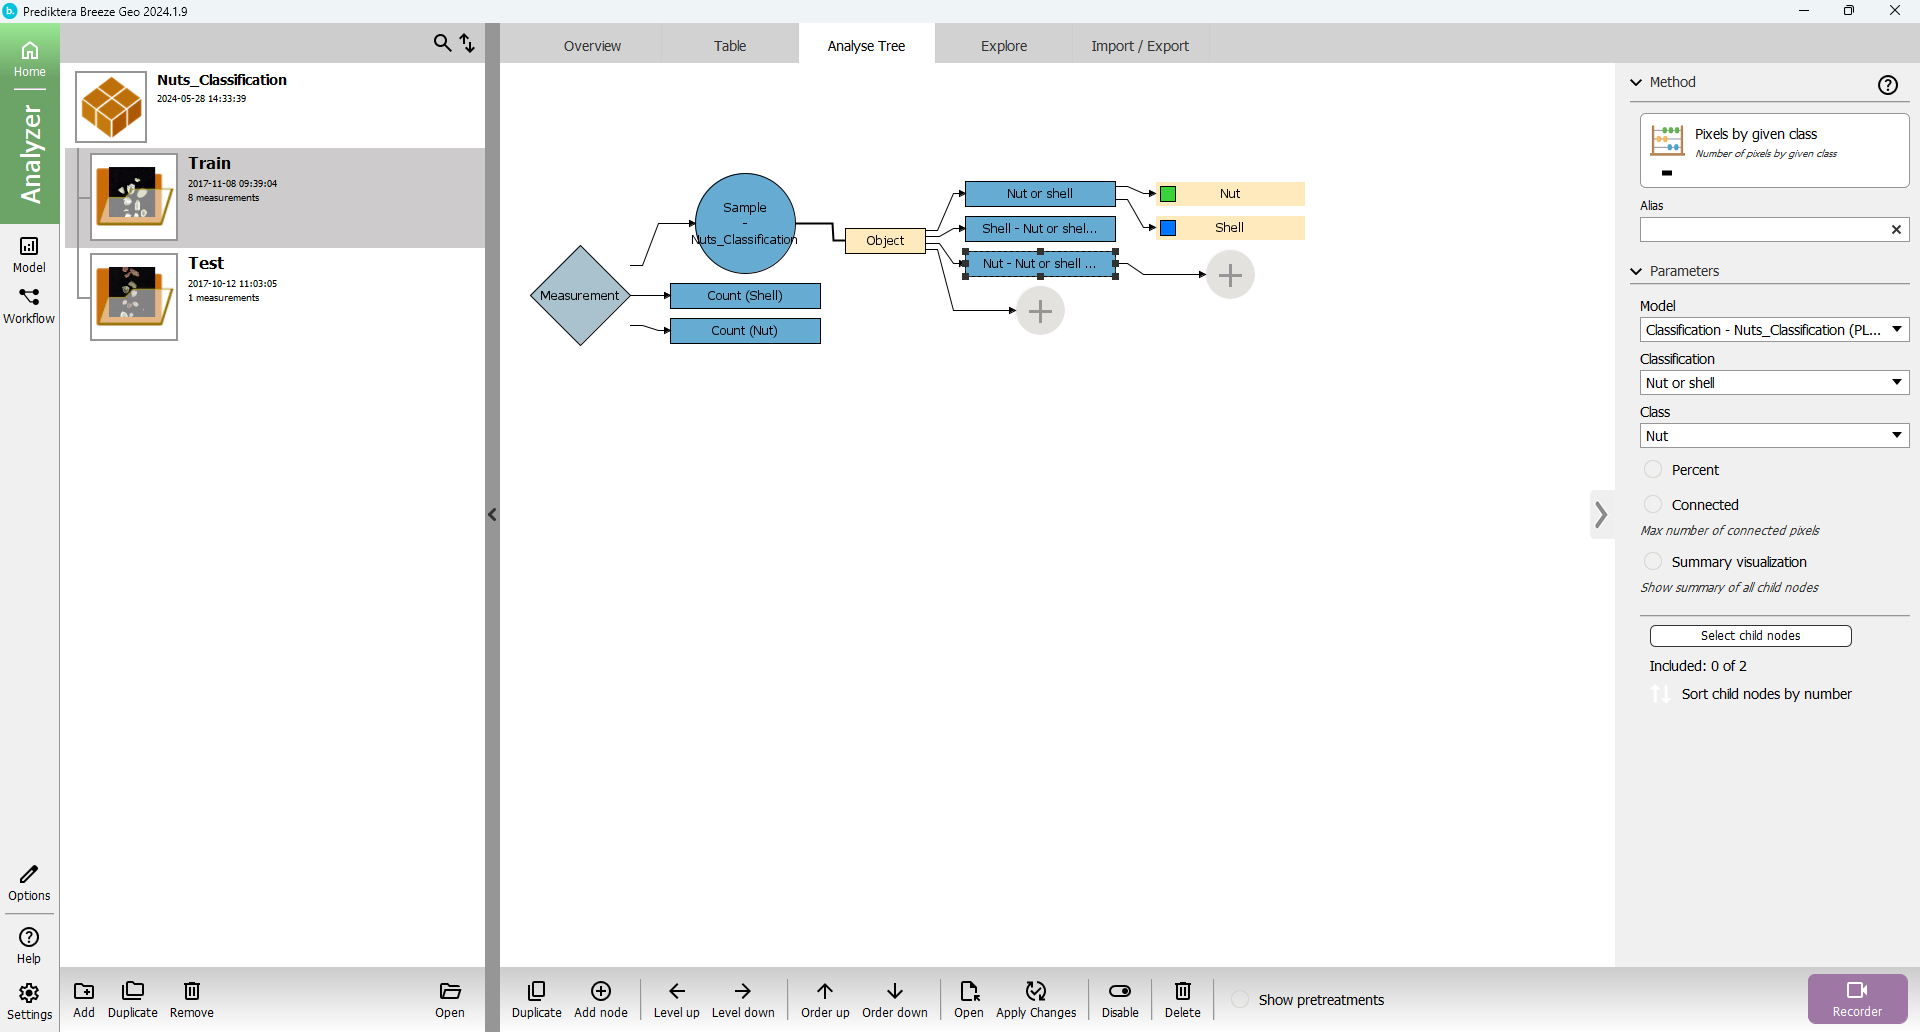
For example, Select “Nut or shell” and press “Down” two times.
The descriptor will then move to the bottom
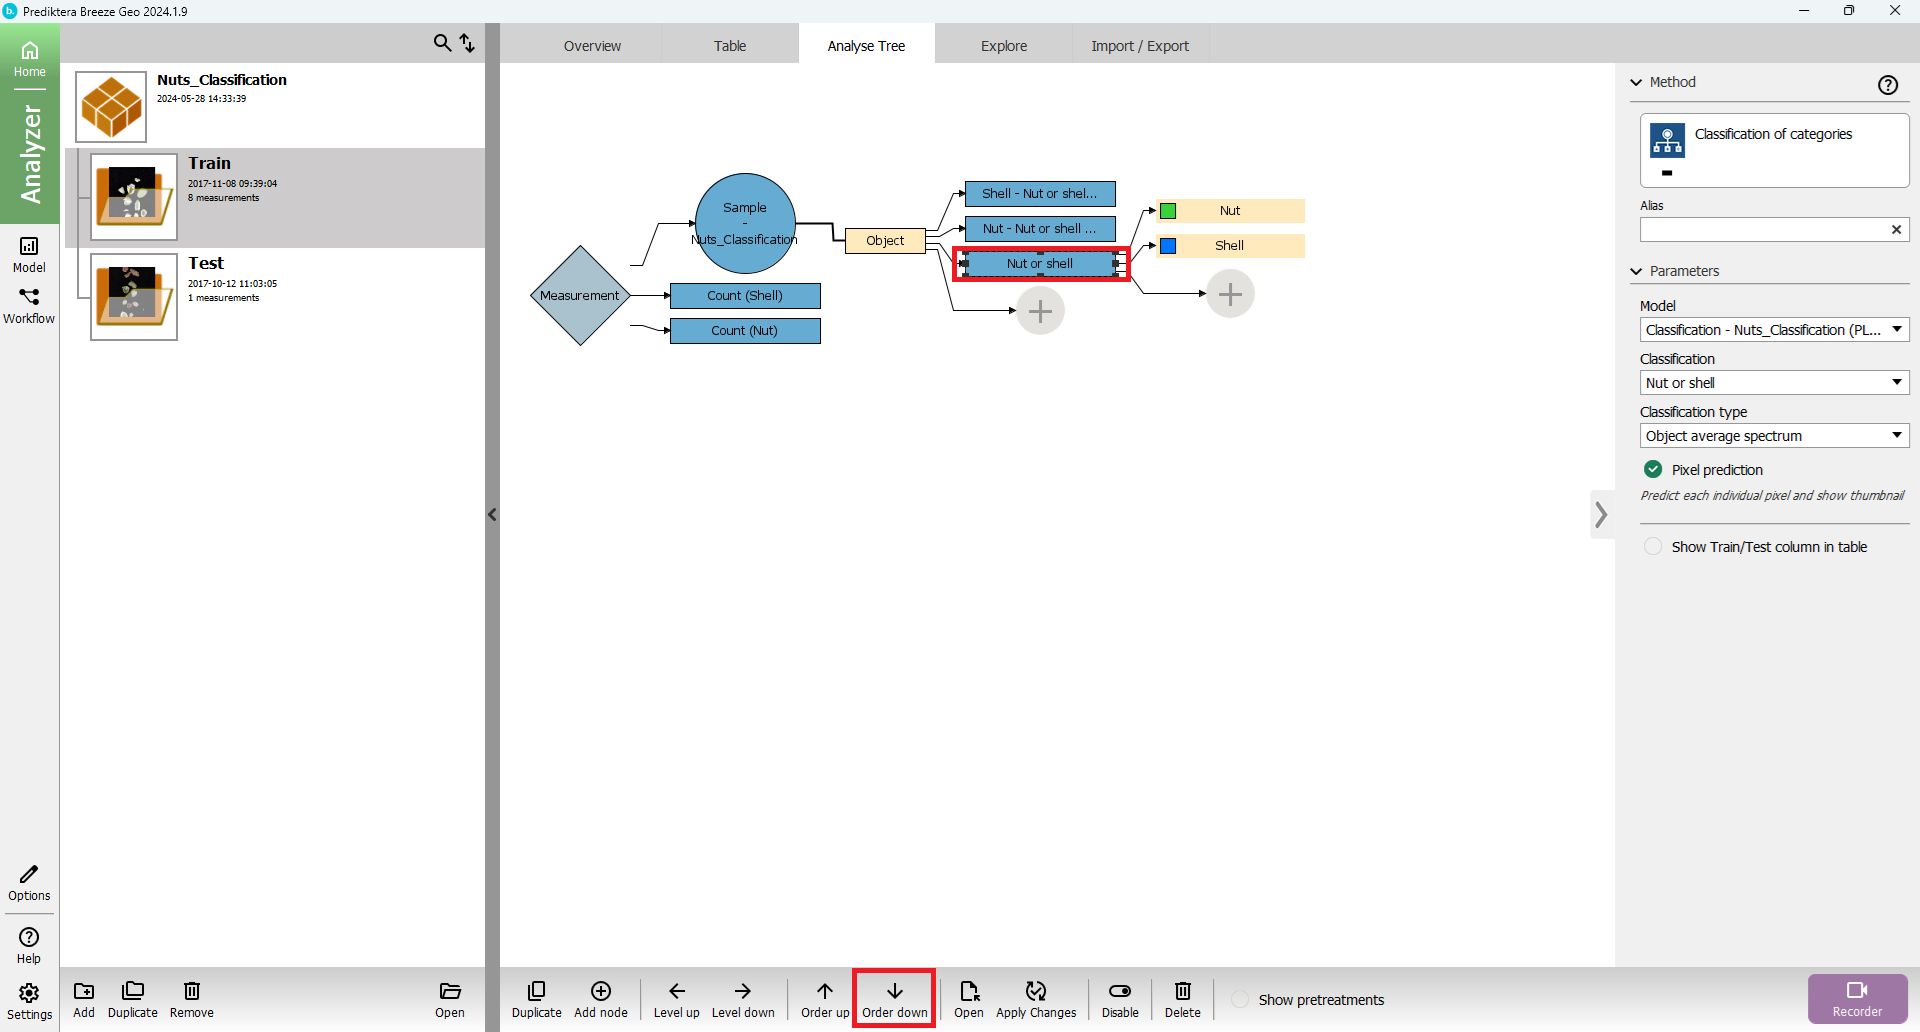
The descriptor will also change its order in the table to the right side.
Level up and down
You can use the “Level up” and “Level down” buttons to move a descriptor or segmentation to a down to a sub-segmentation or up to a parent segmentation in the analysis tree
For example. Select “Count (Nut)” and press “Level down”.
The descriptor will then move to the “Sample - Nuts_Classification” segmentation: