Breeze Runtime Client is an application bundled with Breeze that can be used to control the Breeze Runtime and visualize data from workflows executing in real-time. It can be used as a companion to third party applications and has built-in diagnostics to troubleshoot workflows.
About Breeze Runtime Client
Breeze Runtime Client uses only the Runtime API to obtain data, unlike desktop Breeze which also uses file-based access to the workspace and internal APIs. Breeze Runtime Client can be seen as an example that shows what data are available from the Breeze Runtime, but Breeze Runtime Client does not offer the full Breeze functionality to create projects, change workflows, or do editing of captured data.
The functionality of Breeze Runtime Client is:
-
Change hardware and other Settings, workspace location, and manage the license using the Menu. This works the same as when using desktop Breeze.
-
Click the Connect button to Runtime to manage workflows available in the Runtime:
-
Control workflows: load, start prediction, start capture on predict, update some properties of the Analysis Tree, run diagnostics, view reference data and see Runtime status
-
Visualize output predictions from the running workflow, toggling between different visualizations. View a table of objects identified by the workflow. The live visualization can be used by operators to take manual action based on the classifications from the workflow, and to troubleshoot a workflow's execution and data, without having to do custom code in a third-party application to visualize the output data stream.
-
-
Click the Recordings button: View measurements captured by a running workflow when recording raw data (Capture on Predict).
These features are described below.
More than one Breeze Runtime Client at the time can connect to the same Runtime. Breeze Runtime Client can be run on another PC than the Runtime, if the Runtime settings are changed in the workspace to specify the remote Runtime address.
Starting Breeze Runtime Client
Start Breeze Runtime Client from Windows start.
If the Breeze Runtime is already running, for example because Breeze or a third-party application is using it, the Breeze Runtime Client will display the current workflow. Learn more below how it can be controlled or monitored.
If no Runtime is running when Breeze Runtime Client is started, you are presented with this screen:
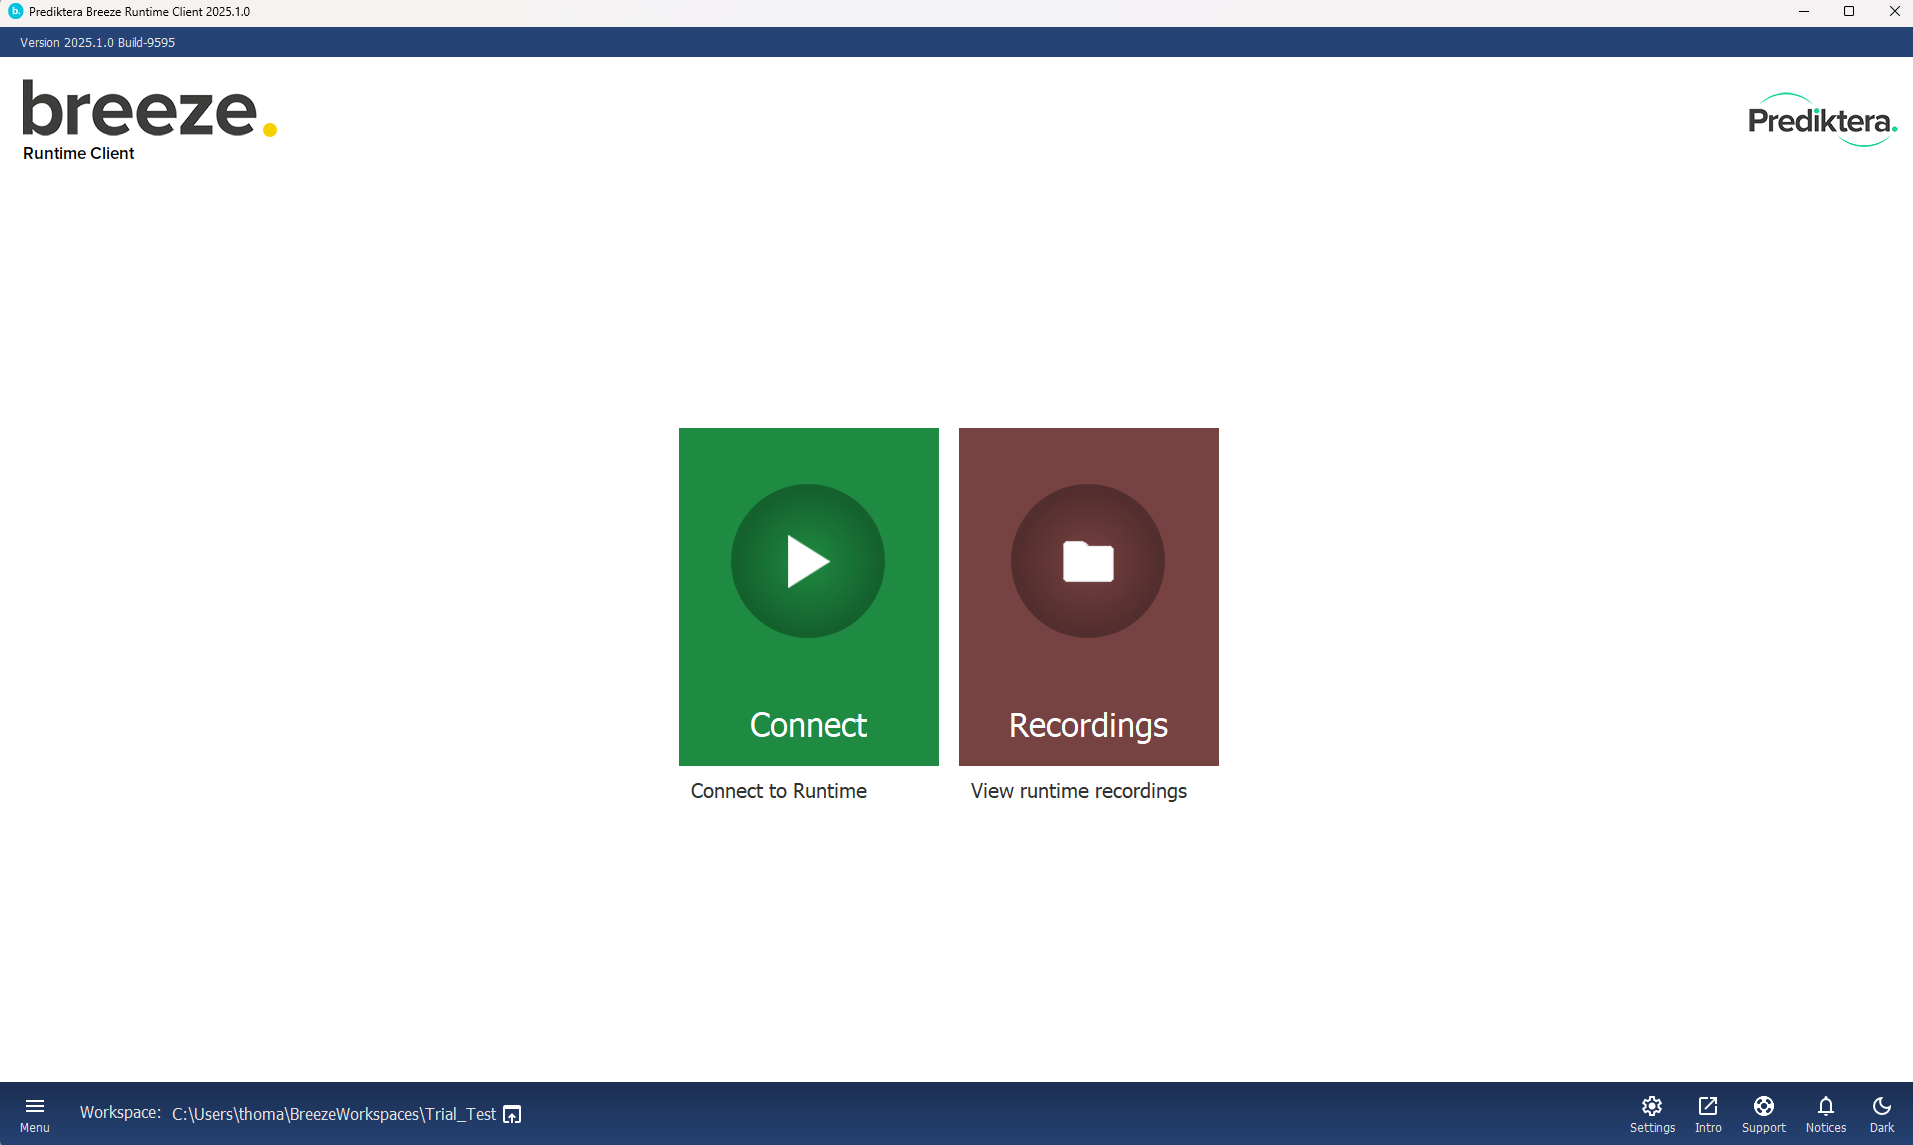
Click Connect to start the Runtime process, and list available workflows.
When the Runtime is started by Breeze Runtime Client or Breeze, it is automatically closed when the application is closed, unlike when the Runtime is already running when Breeze is started.
Manage workflows
After clicking Connect in the main screen a list of workflows is displayed:
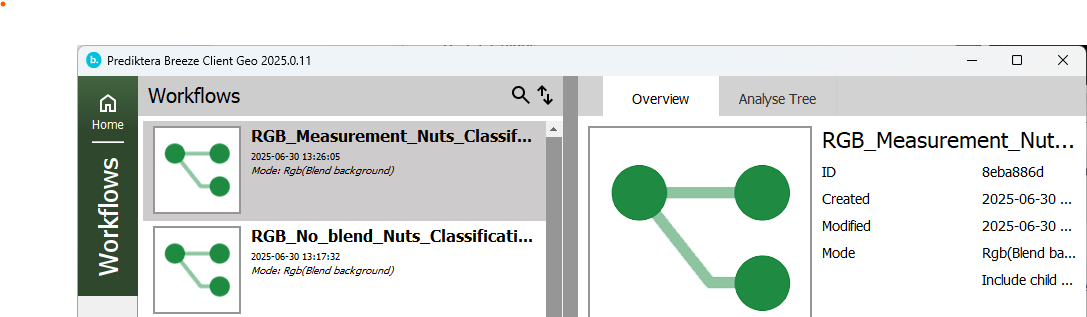
The workflows listed are the ones that have been exported to the Runtime from Breeze as described in Introduction to Breeze Runtime development, or imported in Breeze Runtime Client using the Import workflows button.
Select a workflow to show information about it on the Overview tab and click the Analyse Tree to display it.
Use the Remove button to delete a workflows from the Runtime.
Double-click or click Open to open the workflow.
Working with a workflow
Once a workflow has been opened, you’ll see the main screen:
At the top there is a list of tabs:
-
Overview, Status and Analyse Tree tabs show metadata about the workflow.
-
Realtime shows a visualization of the current process (see below).
-
The References tab can be used to view the latest captured white and dark references. The references is stored in the folder
[Workspace Folder]\Data\Runtime\References.If there are more than one camera, each camera gets its own References tab. -
The Performance diagnostics tab can be used to troubleshoot performance issues.
At the bottom of the screen there are command buttons for controlling the workflow:
-
Use Play or Stop to control real-time prediction of the workflow. Note: these buttons are not visible when Breeze Runtime Client has connected to a Runtime that was started by another process. This is by design.
-
The switch Record data is used to turn on recording of data to disk. Learn more in Recording Runtime data.
Analysis Tree in Runtime Client
You can view the Analysis Tree for an open workflow by clicking the tab:
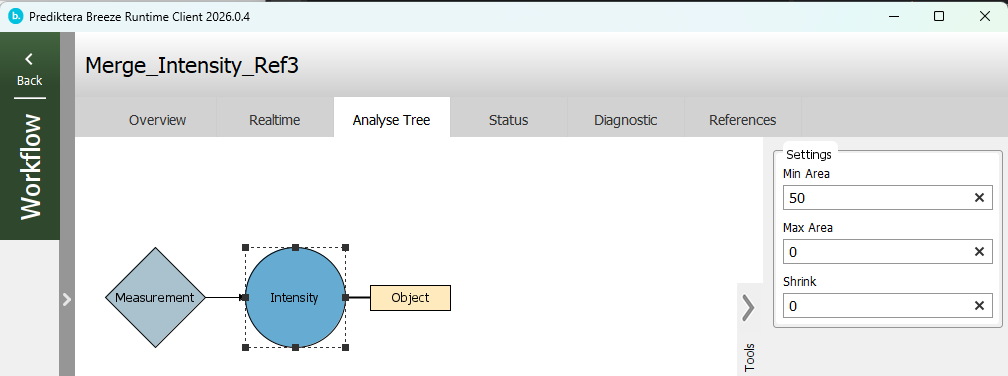
Select a node, like Intensity in the above screenshot, and update properties using the Tools panel to the right. This can be done while the workflow is executing to update its behaviour.
Only certain properties of the nodes can be modified like this. If you want to make larger charges to the Analysis Tree, you can do that in Breeze and re-export to the Runtime.
If the Analysis Tree uses hierarchical models, the tree will appear flattened when visualized in the Runtime client so that all output from the hierarchical models is displayed at the same level.
If you have excluded classes in some levels in the hierarchy, those will be displayed in the Runtime client’s visualization, but the models will still not classify any objects as belonging to excluded classes.
Visualize data
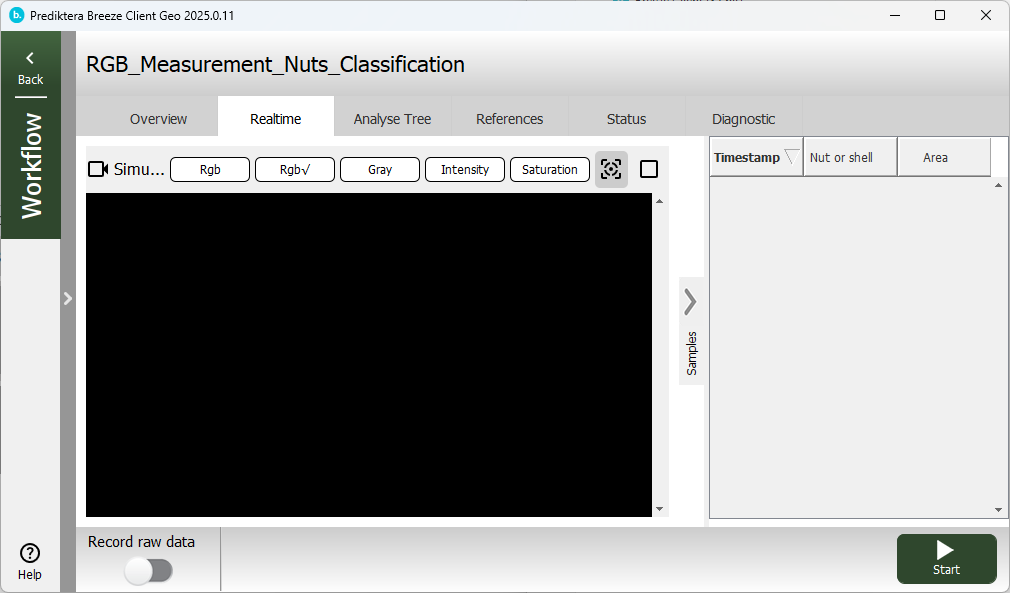
The Realtime tab is used to visualize the workflow while it is running:
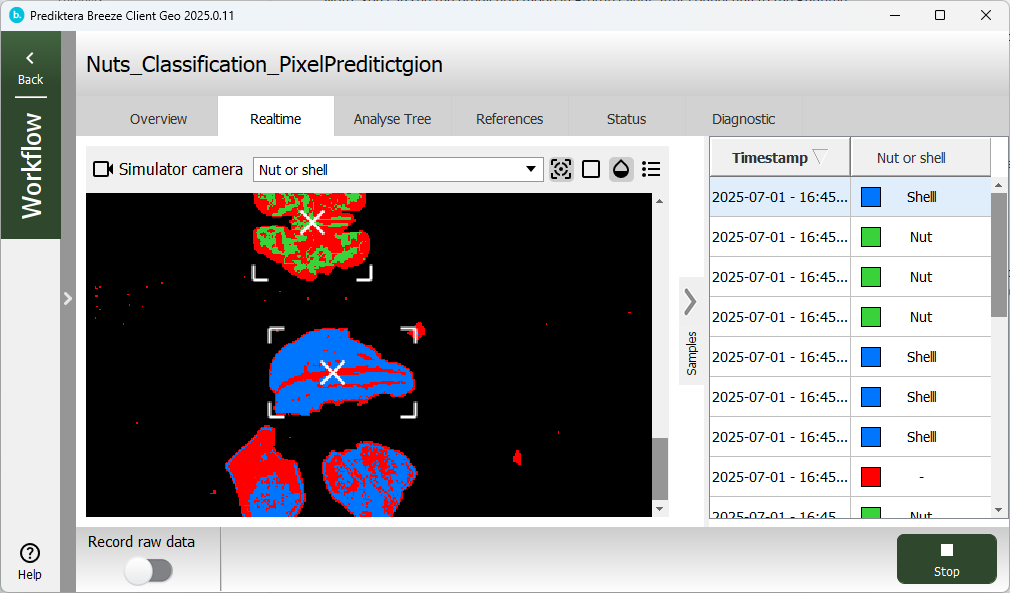
To the left you’ll see the live stream from the camera scrolling by.
Use the scrollbar and scroll up to show slightly older data. There is limited buffer, so you cannot go back arbitrarily far, but you can use this feature to have a permanent offset to display for example 3 seconds old data. Scroll to the end again to show the most current data.
Use the top toolbar to change how the data is displayed. Switch between variables or the RGB visualization modes using the dropdown, and use the toolbar buttons to show object tracking marks, object borders, blend mode for RGB and the legend.
The data displayed on the Realtime corresponds to the output Data stream from the Runtime. Learn more about this and the different Prediction modes that control the visualization in Introduction to Breeze Runtime development. If the workflow uses the RGB Prediction mode you will see a pseudo RGB visualization of the data using the selected RGB bands. If the workflow uses Pixel Prediction Lines, the visualization will only show the output variables of the workflow, not any pseudo RGB bands. Learn more about the data stream prediction modes in
To the right you’ll see a table with object that have been identified by the workflow. Click on column headers to change sorting. The data in this table corresponds to the Runtime’s Event stream.
View captured measurements
As noted above you can toggle Record raw data to record the full spectral data from the camera.
These measurements can be viewed in Breeze by clicking Records in the main screen. You are presented with a date-based listing of groups of recordings:
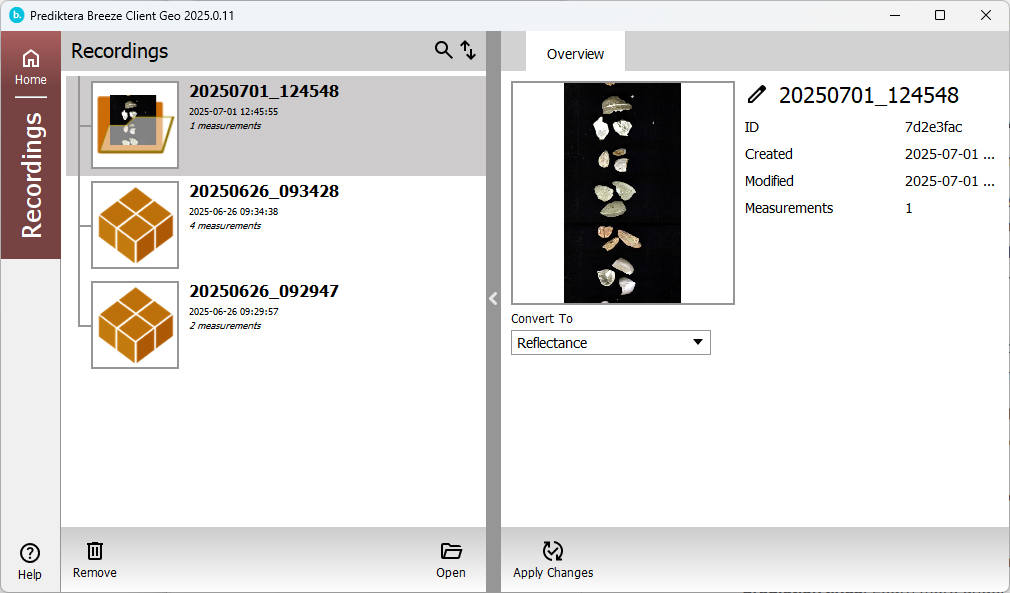
Right-click to show a context menu with renaming, deleting, or opening the location in Windows File Explorer.
Double-click to open a group and you see the measurements in it with one measurement selected:
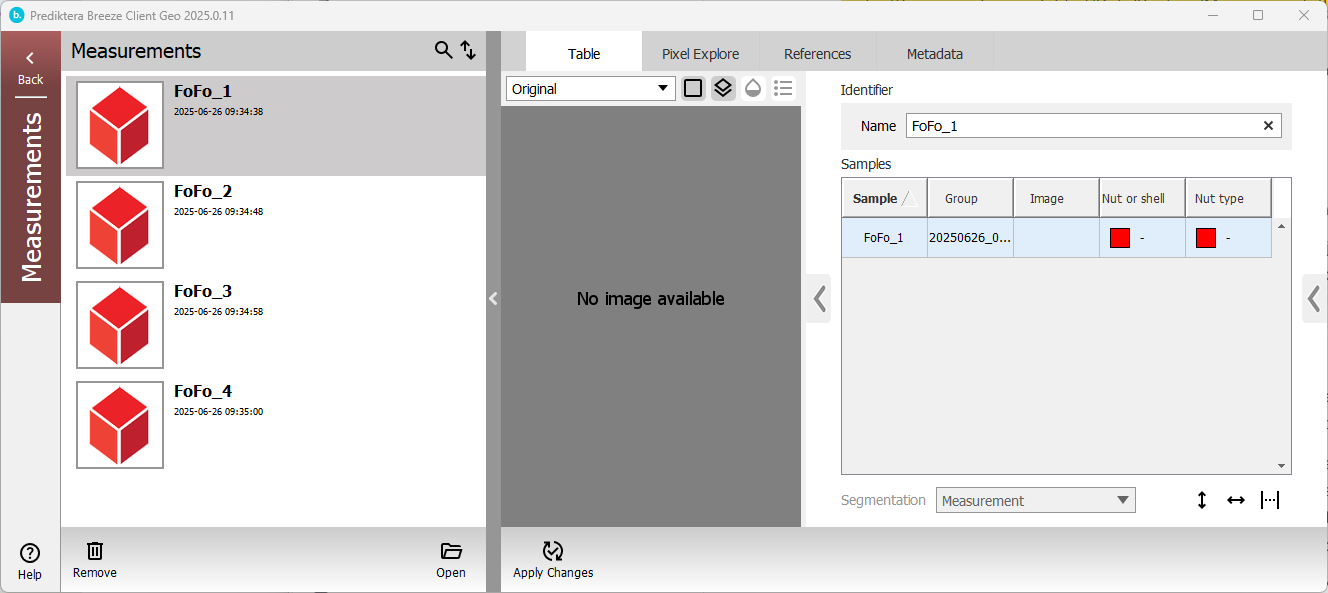
Here there are four tabs to switch between:
-
Table shows the objects that are contained in the image (if any) with the columns showing data about the object.
-
In Pixel Explore you can view the full spectral raw data of the image
-
References show the white and dark references that were used when the image was captured
-
Metadata shows things like size, resolution, number of bands.
You can copy these images to desktop Breeze by right-clicking and selecting Open in File Browser to locate the files.