Breeze uses three channel RGB visualizations to visualize hyperspectral data on screen. Histogram Normalization optimizes the visual quality of RGB images generated from spectral data.
How it works
When a measurement is recorded or data imported to Breeze, a three channel RGB visualization is created using three bands, out of the many more bands, in the hyperspectral data. These bands can be changed as you’ll see in the next section.
Instead of a simple linear scale, Breeze uses the statistical distribution of pixel intensities to ensure the resulting RGB image has good contrast and natural colors, even under varying illumination or sensor conditions.
The process analyzes the spread of values across 10 000 intensity buckets, by default. By identifying the core range of data—excluding the extreme top and bottom outliers (spurious noise)—it stretches the remaining values to fill the full RGB range (0–255).
There are settings you can change to tune this as you’ll see below.
Specifying RGB bands to use
Each measurement in Breeze contains settings for which bands to use as the R, G and B channels respectively.
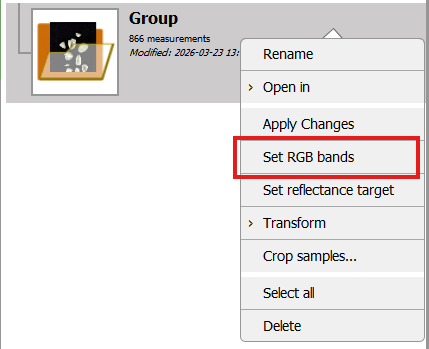
You can change these bands by right clicking measurements, a group or the entire project in Breeze and selecting Set RGB Bands.
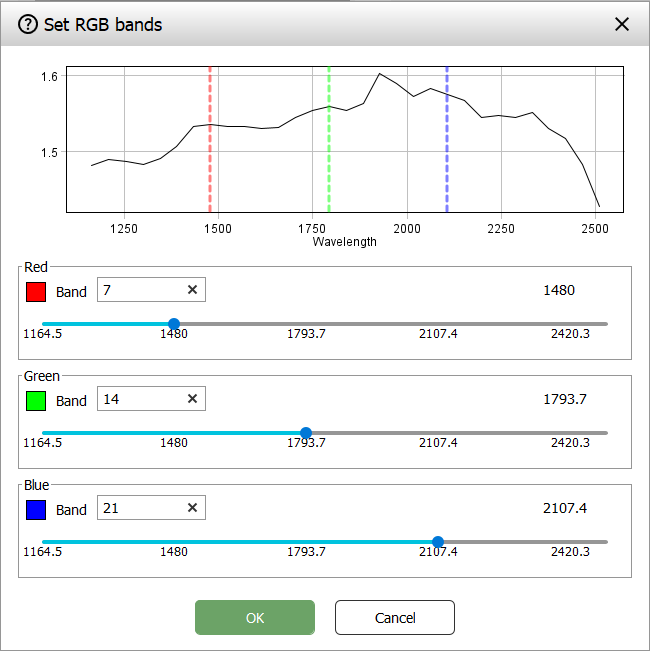
Drag the sliders or specifying band numbers and click OK to apply.
If you select measurements that use different wavelength bands, the first measurement’s bands will be displayed in the dialog, and the bands you specify will be used for all selected measurements when clicking OK.
Changing settings to optimize RGB images and re-computing them
You can tune the settings for Histogram normalization to make the RGB images in Breeze work best for you. You do this by changing parameters in a project’s Project options.
After changing settings, existing data is not re-computed automatically, so to update existing images, you must trigger this manually by using the Set RGB Bands functionality as described above.
Note that you don’t have change the bands you use, simply trigger the dialog and click OK to recompute the RGB image using the current Project option settings.
Why colors change when cropping
Histogram normalization is recalculated based on the pixels currently present in the image. This means that if you crop an image or change its content, the statistical distribution of pixel intensities changes, and the resulting RGB colors will shift - even though the underlying spectral data is unchanged.
For example, if an image includes dark borders or empty tray space, those low-intensity pixels pull down the histogram range. Cropping them out causes the normalization to recalculate over a narrower, brighter set of values, which can make the colors appear noticeably different (e.g, a blue background becoming dark, or green objects appearing red). In extreme cases, aggressive histogram stretching on very dark or low-contrast images can reduce visibility of on-screen elements such as text labels.
If you need colors to remain consistent regardless of cropping, disable Histogram Normalization in Project Options.
Pixel Explore differences
The Pixel Explore feature in Breeze utilizes a statistical normalization approach similar to the Evince/Bucket logic. However, while Evince typically uses a lower-resolution 50-bucket system for 2D analysis, Breeze employs a high-precision 10 000-bucket distribution with a 1% outlier rejection. This results in more granular contrast stretching and subtle differences in visual intensity compared to the legacy Evince rendering.
Visualization settings in Project options
Project options have settings that control the histogram normalization for a specific project. Here you can turn on or off the feature, and also tune individual parameters used by the algorithm.
The parameters are:
-
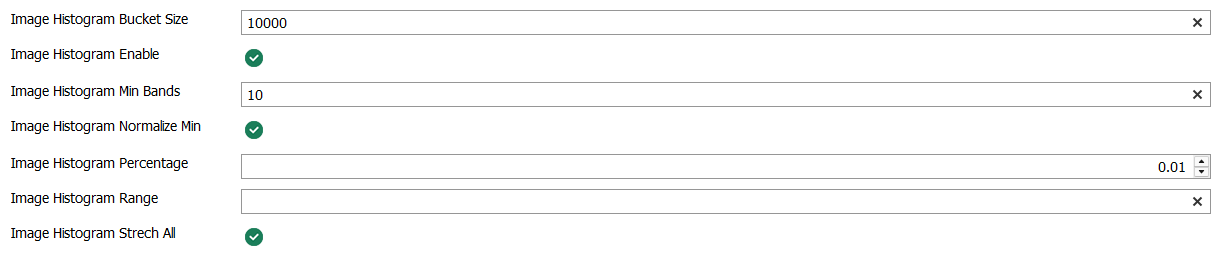
Image Histogram number of buckets - the number of buckets used in the histogram smoothing. The default 10 000 usually works fine, but the number can be increased for cameras with high max signal and similarly decreased for cameras with lower max signals (like RGB cameras).
-
Image Histogram Enable - turn on or off the feature for the project.
-
Image Histogram number Min Bands - the minimum number of bands an image must have before Histogram normalization is used. Also see the Global Workspace setting below.
-
Image Histogram Normalize min - if selected, the actual minimum value in the measurement is used as the start of histogram normalization. If not selected, 0 is used as the start.
-
Histogram Percentage - determines how much of the extreme dark and light data is ignored when calculating the stretch. A setting of 0.01 (1%) ensures that a few dead pixels or glints of light don't cause the entire image to look dark or washed out. On the other hand, if you want to ensure the brightest parts of the image is visible you can change this to 0.0.
-
Stretch All Channels - when enabled, each color channel (Red, Green, Blue) is normalized independently. This is highly effective for correcting "color casts" caused by uneven lighting. When disabled, a single global normalization is applied to preserve the original color ratios.
Image Histogram Range - This parameter is not used for Histogram normalization but only used for real-time RGB visualization. To use this setting, specify a list of semicolon-separated floating-point values that define the min and max raw signal values to use for the three RGB channels (before normalization to the RGB range).
Global Workspace settings
You can turn on or off histogram normalization depending on the number of bands in the images on the General tab of Workspace Settings. As all workspace settings, this affects all project in the workspace.
Minimum number of bands for normalization
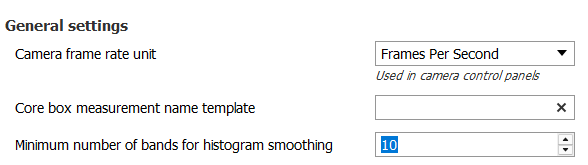
This parameter defines the minimum number of spectral bands a dataset must contain before advanced histogram normalization is applied. Depending on the number of bands, different settings are recommended:
-
High Band Count: For hyperspectral data, normalization helps balance complex spectral responses into a coherent RGB image.
-
Low Band Count: On devices with few bands (like standard RGB or simple multispectral cameras), this prevents over-stretching which can cause natural colors to look distorted or overly processed.