Output data and spectral average data for one or more segmentations from the Analysis tree can be saved as a CSV text file where column separator and decimal separator can be changed.
The CSV file can be opened in a spreadsheet software such as Excel.
How to export
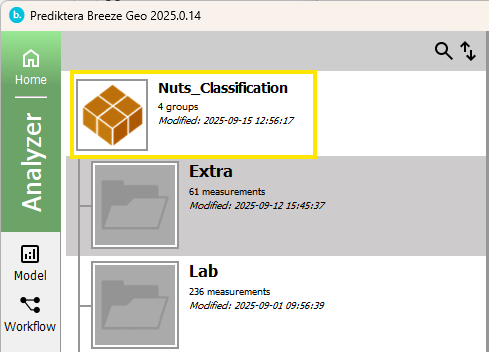
Export always applies to the open project in Breeze, so first make sure a project is opened.
Next, specify the scope of the export by selecting the whole project, one or more groups, or one or more individual measurements inside a group:
Tip: multi-select distinct groups or measurement by CTRL clicking or select a range with Shift-click.
Launch the export wizard on Import / Export tab by clicking the button corresponding to the export you want to do.
A wizard is started that will guide you through the export process. The wizard will begin by asking you for the target folder for the export:
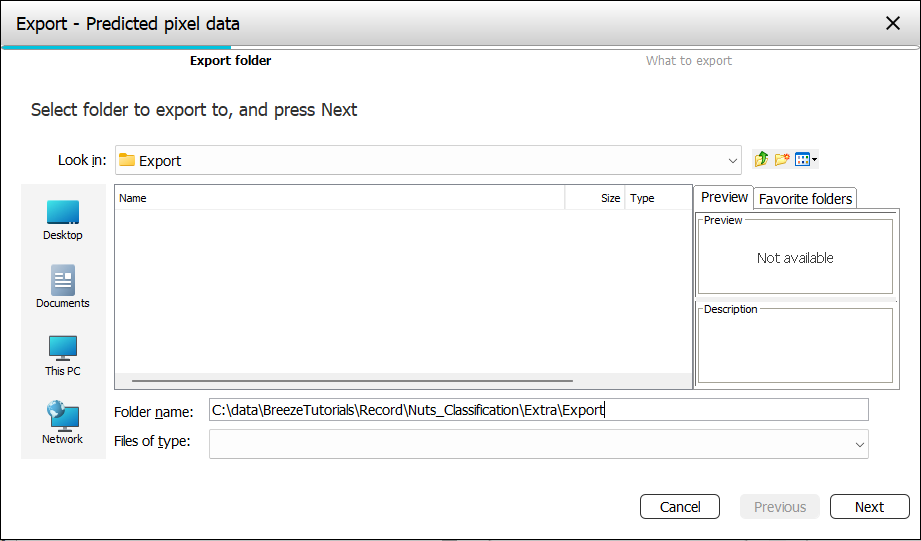
Click Next, and you will be asked for settings for the type of export you selected (described separately for each export).
Finish the wizard to begin exporting, and wait until it finished. The data for the selected items will be exported to the folder you selected.
If you make a large selection, or make complicated export exporting can take a long time. For larger data, it is a good idea to start on a single measurement before trying to export many at once.
When exporting to CSV, a single CSV text file will be created with all data.
-
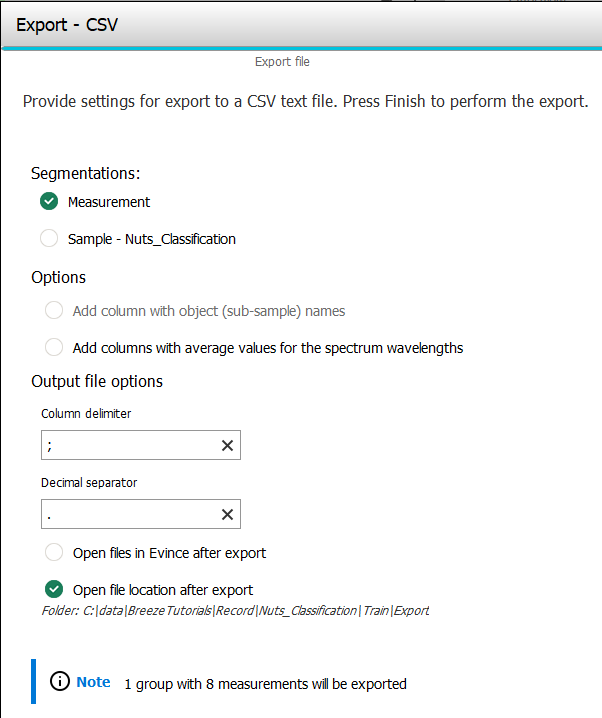
Segmentation - The Analysis Tree with its segmentations and analyses can result in many different objects that have different data. Select the segmentations you want data for. If you select more than one, the resulting CSV will be hierarchical and show all data in the same table.
Options:
-
Add column with object (sub-sample) names. This checkbox is only available if you select a segmentation. It is not available when only the Measurement is selected.
-
Add columns with average values for the spectrum wavelengths. Adds a column for each wavelength in the spectral data. The values for each row is the average for all pixels of the object.
Output file options:
-
Column delimiter and Decimal separator specifies what is used in the resulting text file.
-
Open files in Evince after export. Launch Prediktera’s software Evince and open the exported files for further analysis.
-
Open files in QGIS after export. Launch QGIS and open the exported files for further analysis. This is particularly useful for UAV or other geographical data. (This option is only for exporting spectral or predicted data to images).
-
Open file location after export. The folder you exported to is opened in File Explorer for quick access to the files.
At the bottom of the page you also see a preview of how much data will be exported, given what you selected in Breeze before starting the export.