🎉 Exciting updates in Breeze 2024.1.0! We are thrilled to roll out this new version, packed with major enhancements and minor tweaks designed to boost your hyperspectral imaging analysis. Let's dive into what's new and improved!
Visit us at https://prediktera.com/ to download and learn more
See full feature list below ⬇️
📊 Modeling and statistics
Sequential Quantification and Classification modeling: Apply a unique quantification model to each class in sequence after a classification model. This can provide higher accuracy for quantification analysis in relevant use cases.
Model performance statistics: Model table and Obs vs. calc plot now includes RMSE, RPD and R2 also for training, test and CV for comprehensive model comparison (for CV when using full cross validation).
Statistics for Quantification results: Add absolute, relative, and percentage error metrics to the Statistics (properties) descriptor, see Statistics (properties)
View spectral band model statistics: Show spectral plots for model loadings, weights, importance, and SNR in the model wizard
Custom Python Interpreter Selection: Added option to select a custom Python interpreter, offering greater flexibility when training a custom prediction model or using any Python function.
Cross-validation settings panel in model wizard: Select full- or partial-cross validation, number of CV groups and exclusion protocol.

🖥️ Visualization
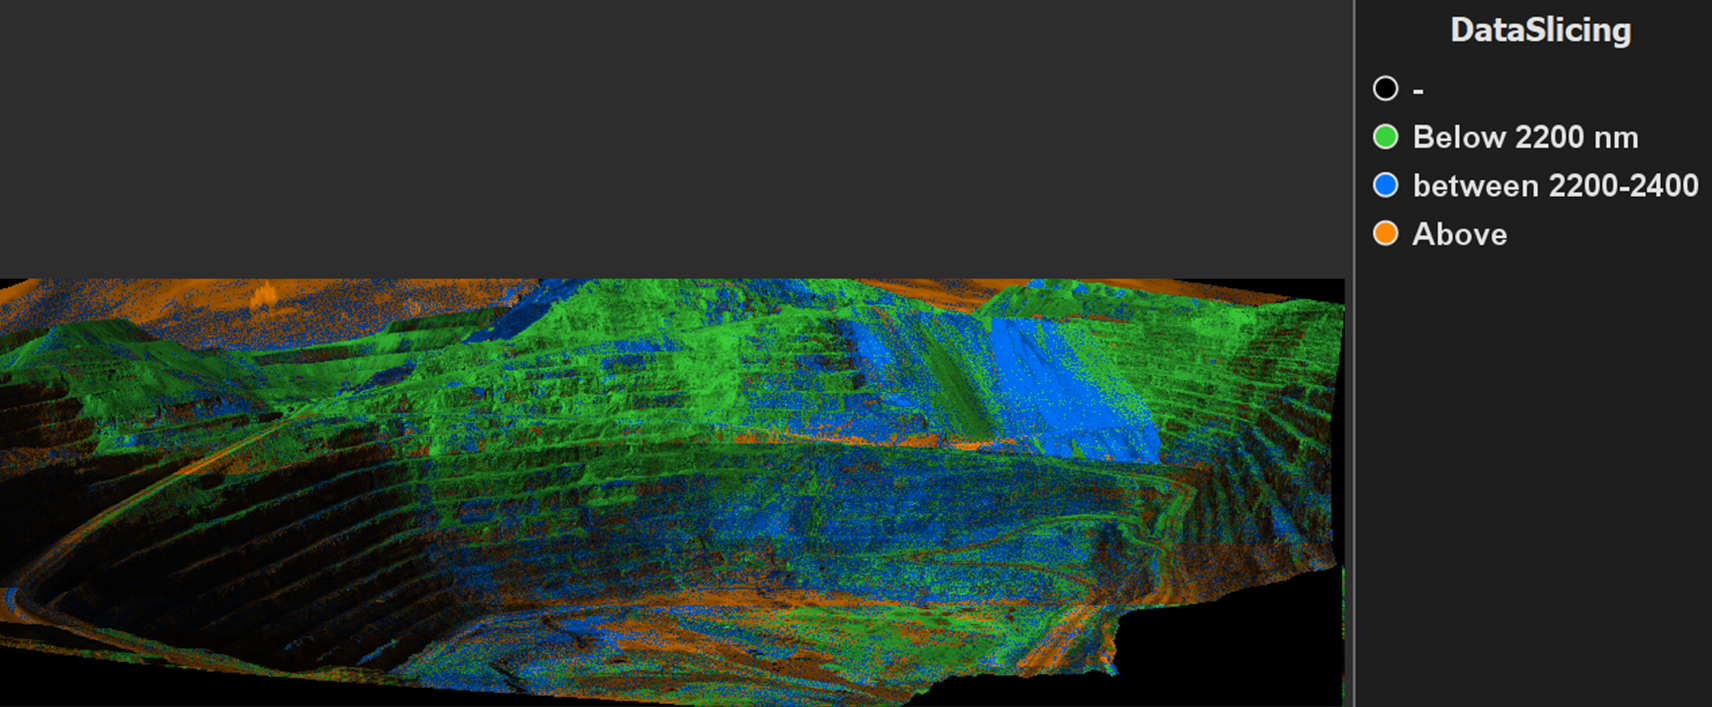
Data Slicing Descriptor: Divide the output of calculated contiuous properties into classes based on specific intervals. Data slicing
Pseudo-RGB Image Descriptor: Combine any 3 properties to generate insightful pseudo-RGB images. Combined RGB image
Summary visualization for "number of pixels by given class": Bar chart visualization in the Table view showing the number of pixels by given class for each object.
Zoom Overview in Image: Enhances image examination by showing the position of the zoom area in the full image.
Pixel coordinate segmentation preview: Preview image shows segmented area for the measurement using the entered pixel coordinates.
Set max and min values for single bands image: Option to change the scale for the single band intensity image in Pixel Explore.
Labels for selected spectra: Write names and select colors for selected and pinned spectra in spectral plots in Explore and Pixel Explore.
🔎 User Interface and Interaction
Create class category from Identifier and Group name: Use sample Identifier column or group name to generate a class category column.
Evince shortcut for object level exploration: Open the object level data in Evince through the Explore tab in Breeze for expanded visualization possibilities.
Selection av samples in Table using classes: Select samples in Table based on descriptor classes.
Spectral plot colored by class in Model wizard: Spectral data is colored by class for each spectrum, making it easier to see which bands are different for different classes.
Pixel Explore Upgrades: More options in Pixel Explore, including changing the visualization of your spectra to raw data, reflectance or absorbance, view wavelength names of RGB bands, and a new zoom toolbar.
View model train/test info in table: Display of a train/test column in the model descriptors table. Train / Test
💾 File Support, Data and Image Import and handling
Single Spectra data import: Import regular spectroscopy data files (i.e. non image data) from a range of file formats like txt, csv, sli, and asd.
Multiple image import: Simplified import of multiple image files located in different folders and directories using the data import wizard.
Flexible Model Application: Apply models to data with different, fewer, or more wavelengths (i.e. spectral bands) than those used in the training set.
More flexibility for applying references: Import dark and white reference after the data import to do data conversion to reflectance and absorbance.
Apply conversion to images with only dark or only white reference: Imported images with only white or dark reference available can now be converted.
Set calibrated reflectance targets values: Select vector file or write manual value on Study, Group or Measurements level via right-click.
Save multiple images as .png: Facilitate saving all images in a study or group with a right-click as a .png image of selected descriptor output.
📸 Data acquisition, Cameras and Hardware Integration
Compatibility with more camera manufacturers and models
-
INNO-SPEC: Speccer (stage), RedEye1.7 HighRes, ColEx (RGB+HSI). INNO-SPEC
-
HAIP Solutions: BlackIndustry VNIR and SWIR, HAIP Solutions
Max length for sample mover: Set a max value for better control of stage movement.
Multiple camera connection: Improved support for connecting multiple cameras simultaneously (up to 10 supported).
Camera setting using frame period or frames per second: Option to use frame period or fps in Hardware settings.
⚙️ Descriptors, segmentation and data processing
Continuum removal transformation: New spectral transformation method available in the model wizard. Pretreatments
Water absorbance band removal: Automatic selection and masking of spectral wavelengths with water absorbance in Pixel Explore, Model wizard and Explore
Spectral band statistics descriptor: Calculate average, max, min and standard deviation on object pixel values for selected spectral bands intensity.
Addition of multiple child nodes for descriptors: Simplify the adding of child nodes for a descriptor in the Analyse Tree.
Intensity segmentation options: Choose conversion to raw, reflectance, or absorbance for the spectra used for segmentation.
⛰️ Breeze Geo specific features
Mineral group classification: USGS PRISM MICA can now also be used for classification of your data into mineral groups in addition to individual minerals. The mineral groups are shown in the Select end members dialog for easy selection of relevant materials groups.
Compartments for depth registration: Simplifies the adding of compartments in the Depth registration Panel. Simply add number of rows, start position, number of compartments, length of each compartment and gap between them. Then use the mouse to adjust the position.
🐞 General Updates and Bug Fixes
Various bug fixes and optimizations to improve stability and user experience.
Print Image Button: Added a convenient print image button in the popup menu.
Upgrade Java to version 21 for enhanced performance and compatibility
License activation can now be done from a file, see How to activate your license offline
Thank you for your interest in Breeze 2024.1.0!
Your journey in advanced hyperspectral imaging analysis just got more exciting and efficient. 🌈🔬📈
Visit us at https://prediktera.com/ to download and learn more