To learn about all features of Recorder, see Breeze Recorder.
This walkthrough shows how to use Recorder to record some data from a camera, look at it in Breeze, and how to optionally export it.
Recorder guide
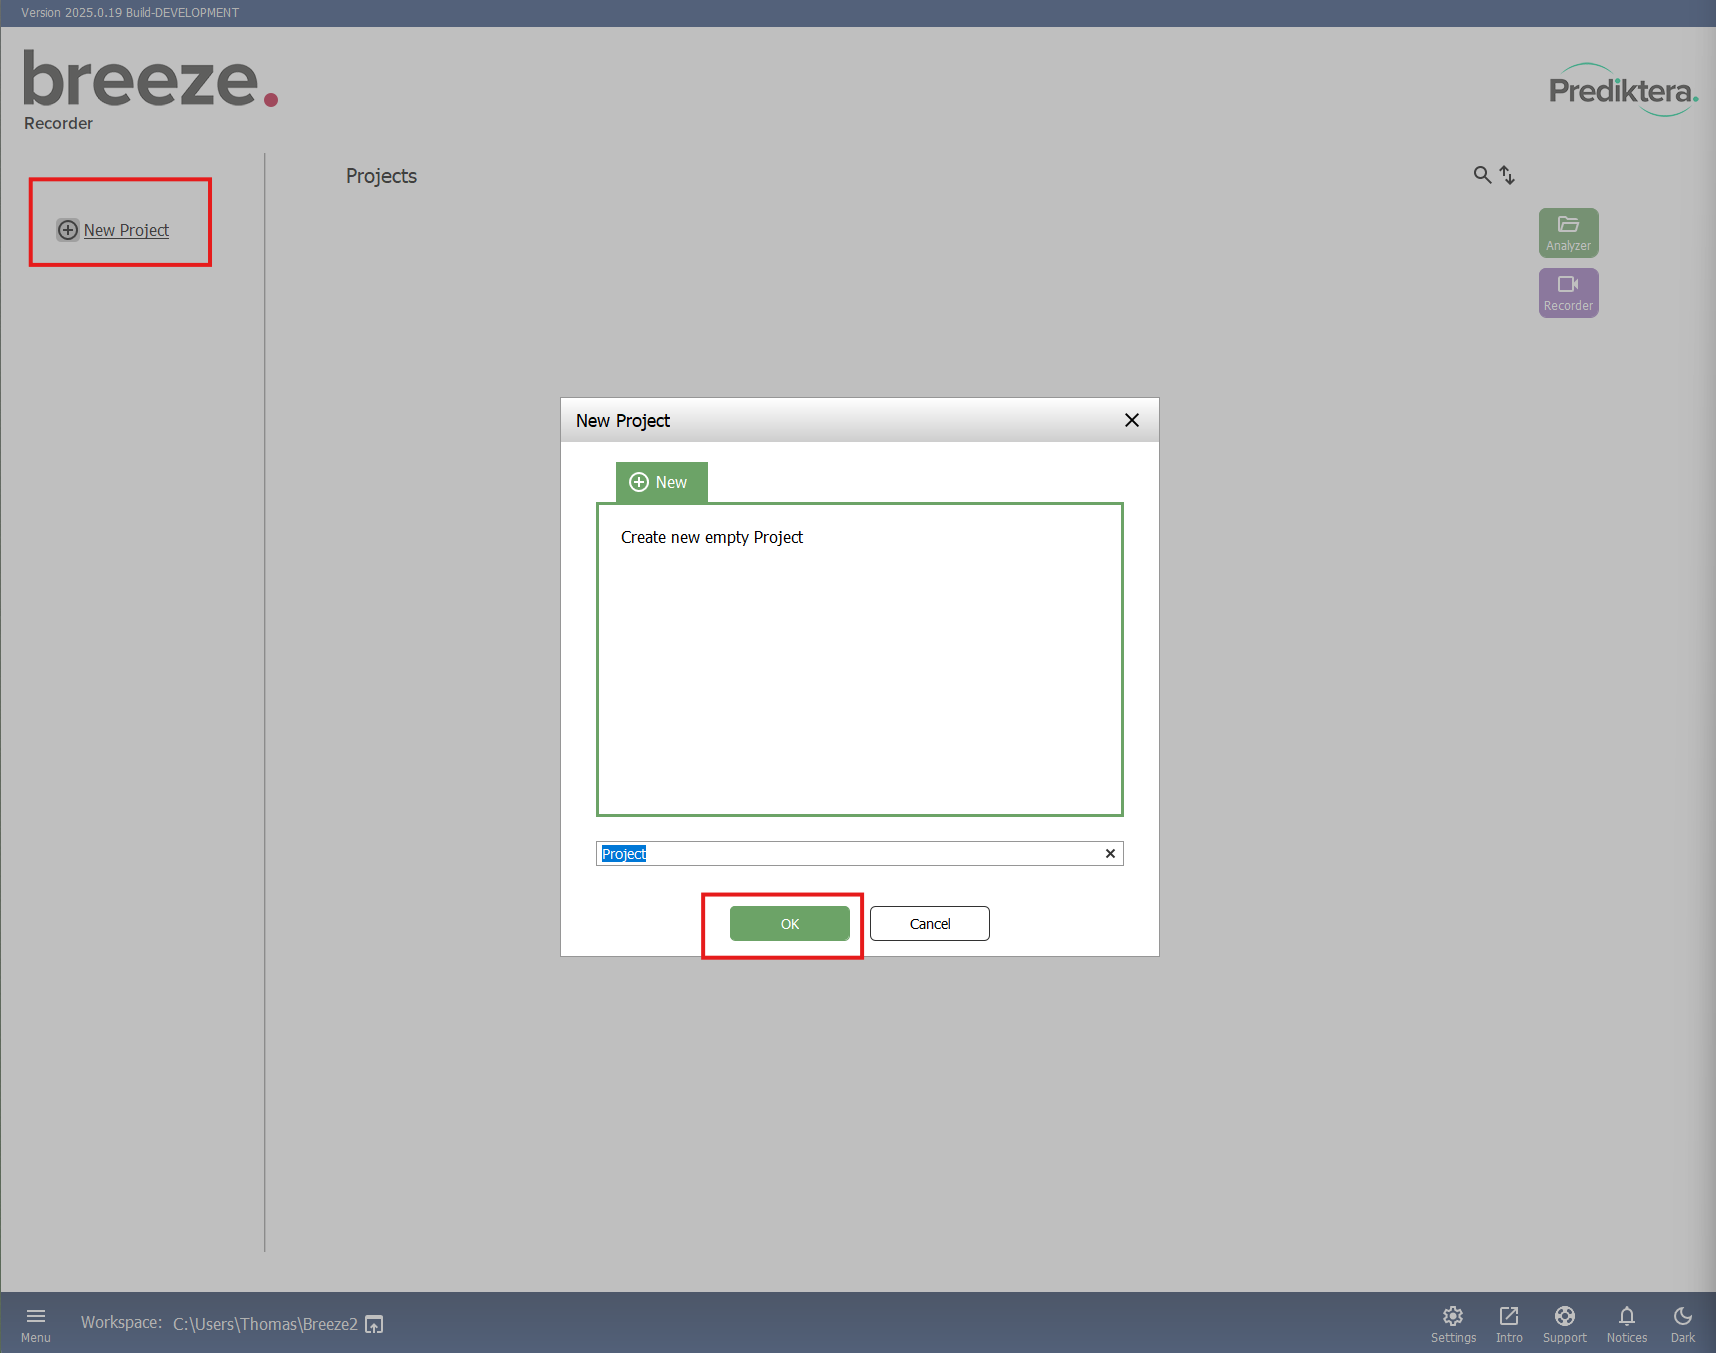
Start Breeze and click on New Project to the left to create a new project to record in.
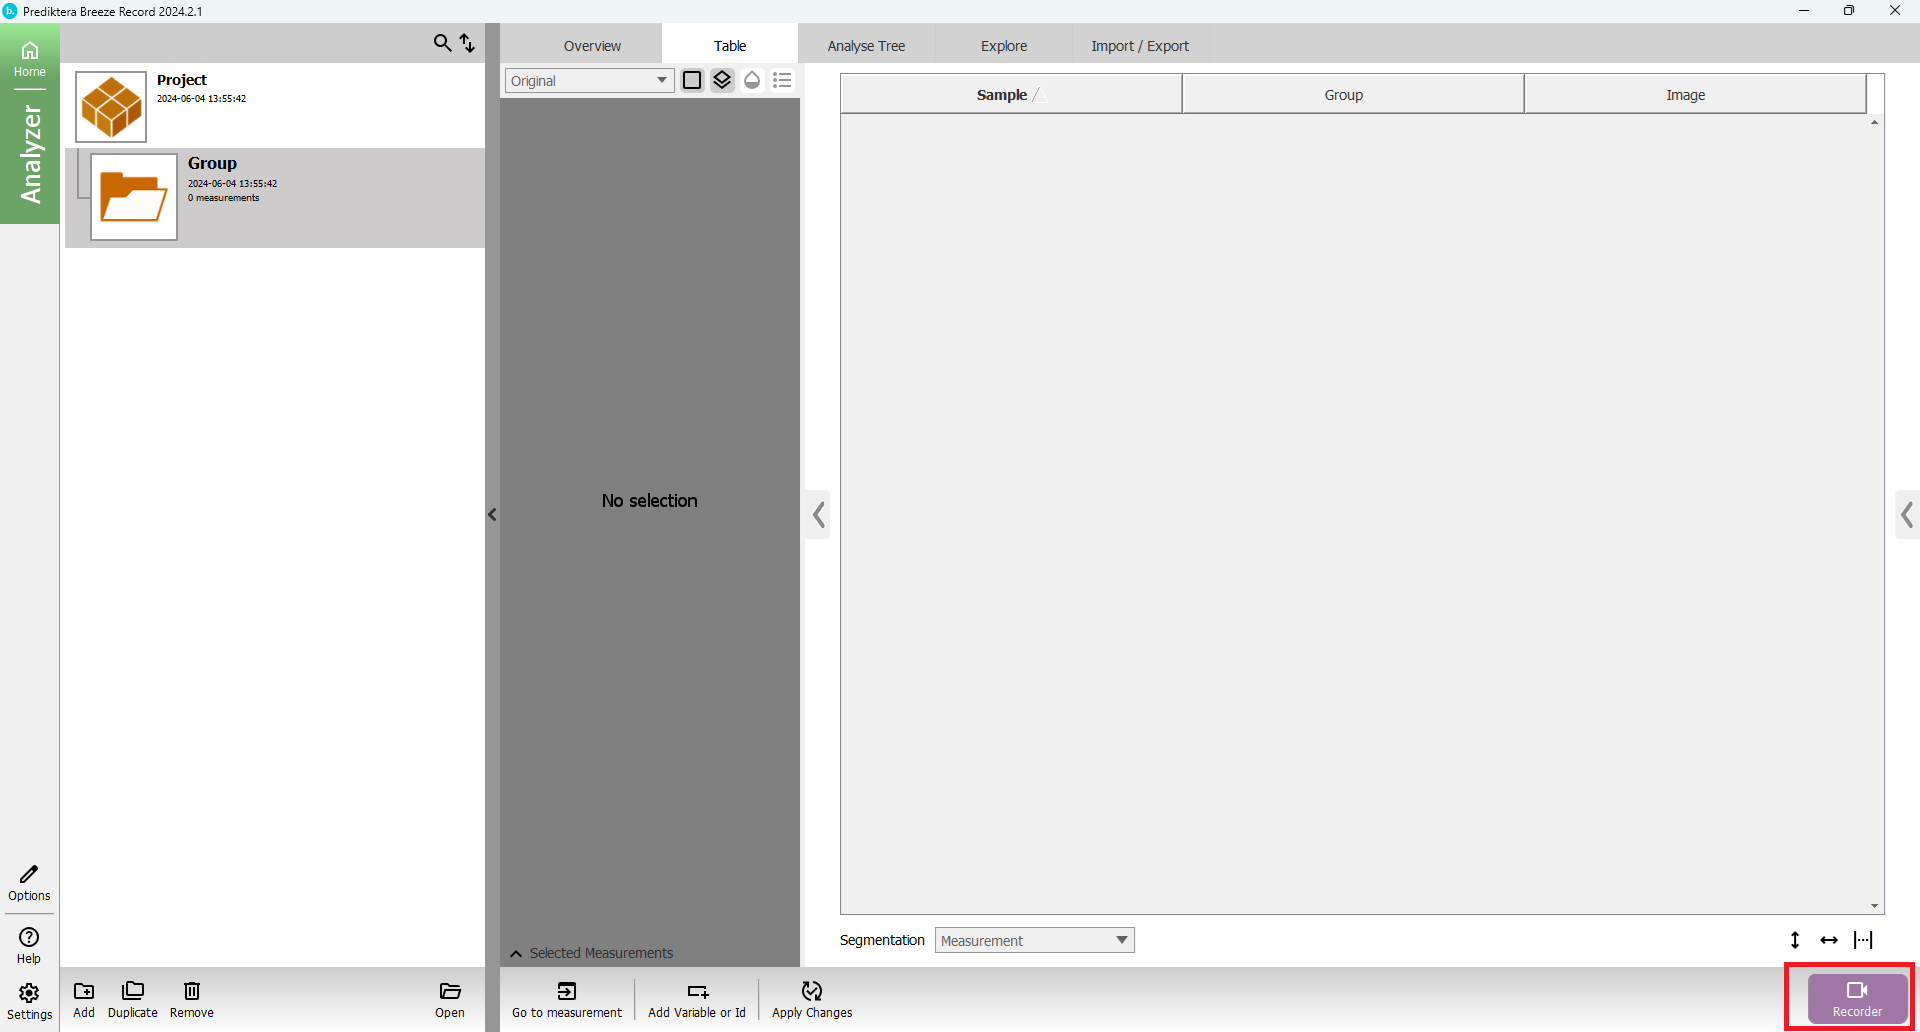
Open Breeze Recorder using the “Recorder” button.
You are now in the data acquisition view.
On the left side you have a panel to enter information and adjust the settings that will be used for recording a new image. You will see the cameras and scanners that Breeze Recorder is connected to.
Set Measurement length (how long the scan will be).
Write your file name (optional: add comments that will be saved as meta info with the image file).
Reference information: Configure if you want to take an automatic white reference or not (“Disable”).
Adjust camera and scanner settings that you want to use for frame period and integration time.

Press the red Record button on the upper left side of the screen to start the data acquisition.
The dark reference will be taken once before the recording, and again at the end after the image has been captured.
If you have configured the camera to capture a new white reference, the table will move to your set white reference location and take the white reference.
The image will then be taken and stored.
Dark and white references will be taken for each recording.
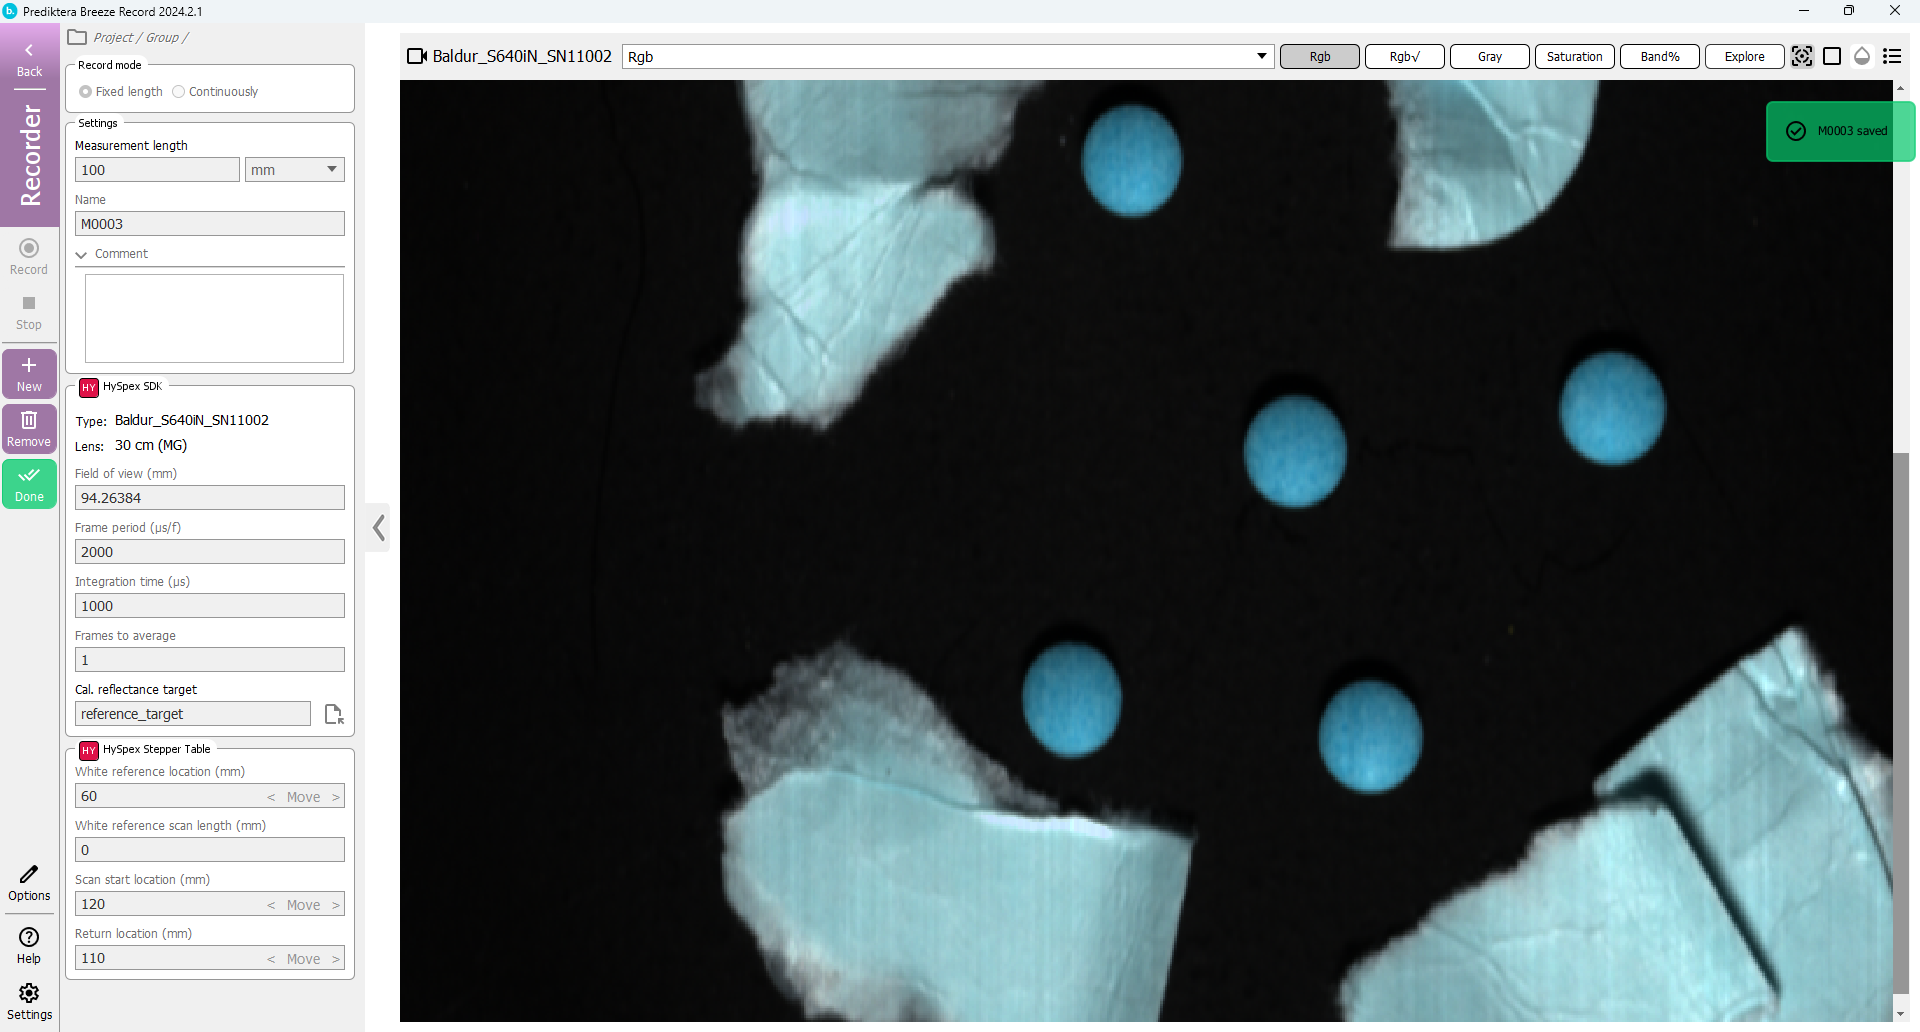
The default view is a pseudo RGB image.
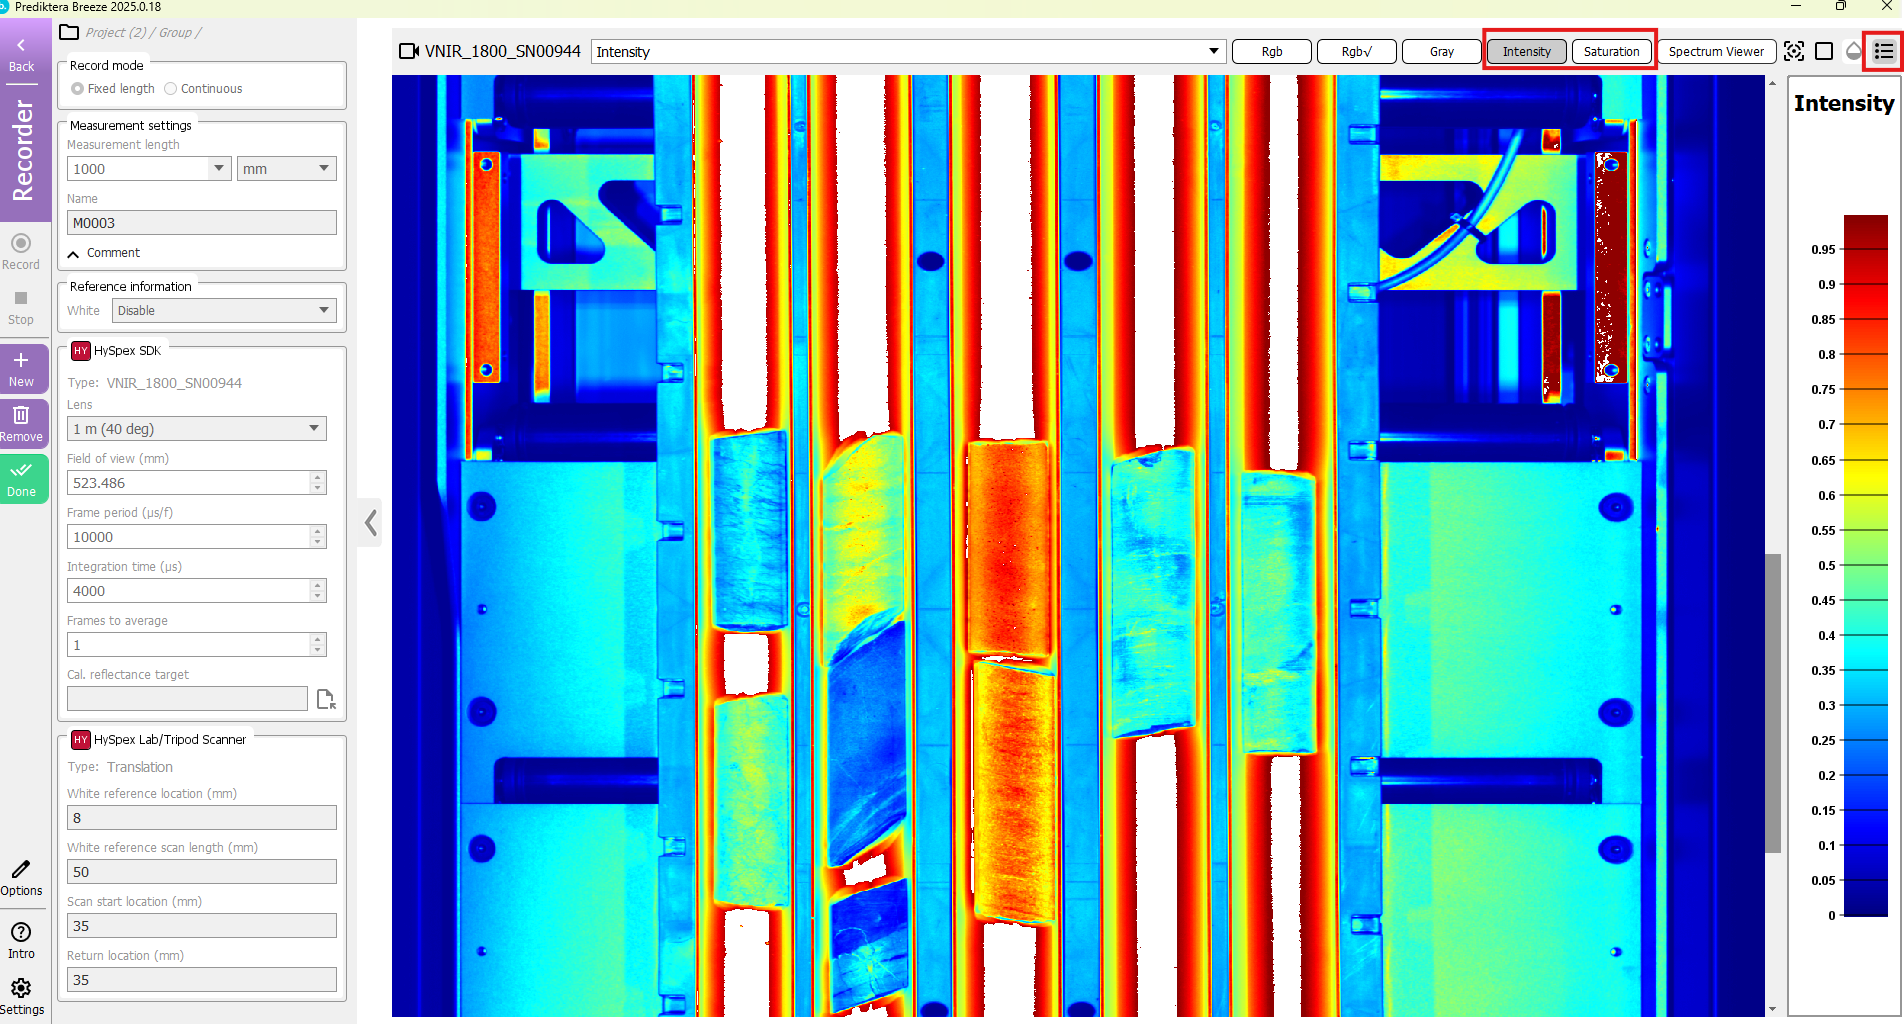
Change to “Intensity” to identify oversaturated areas (white color). The “Saturation” image will show the percentage of bands that are saturated.
Tip If you have saturated pixels on your samples, lower the integration time and record the image again.
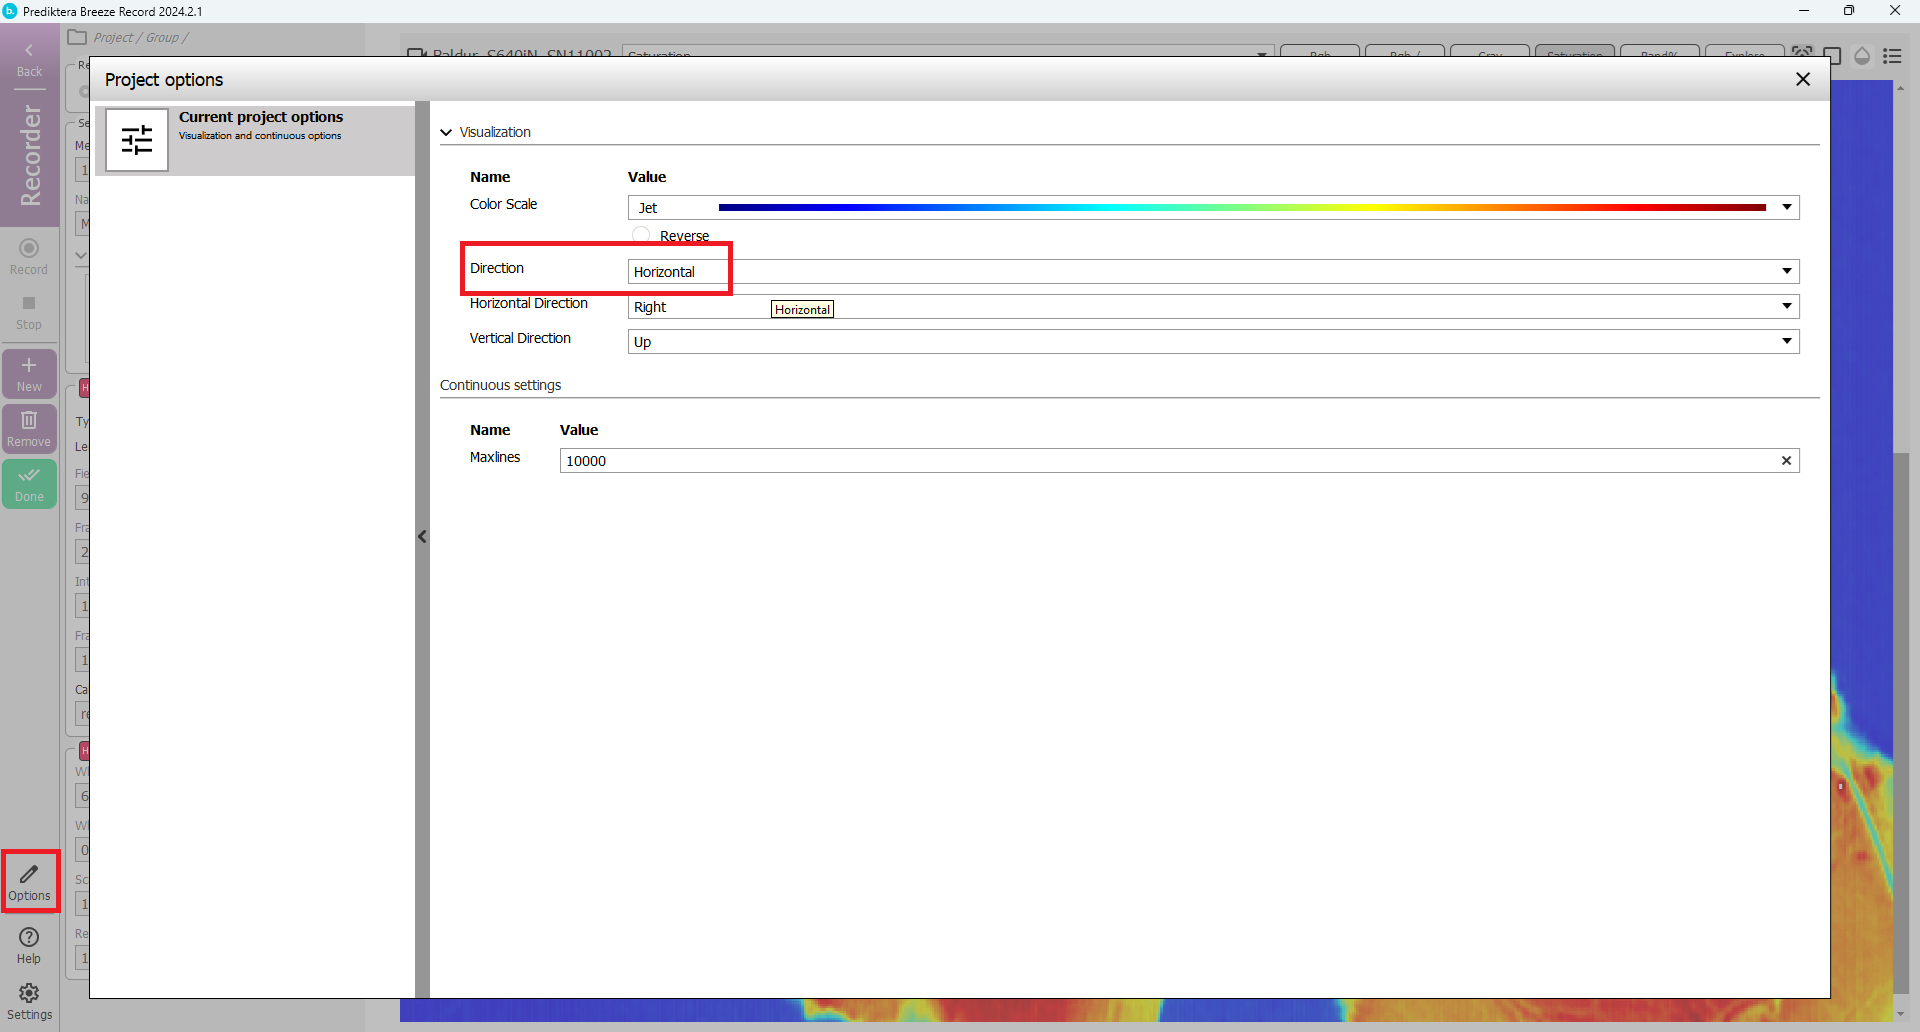
Option: You can change direction of the visualization from vertical to horizontal scanning by pressing the Options button and changing Visualization->Direction.
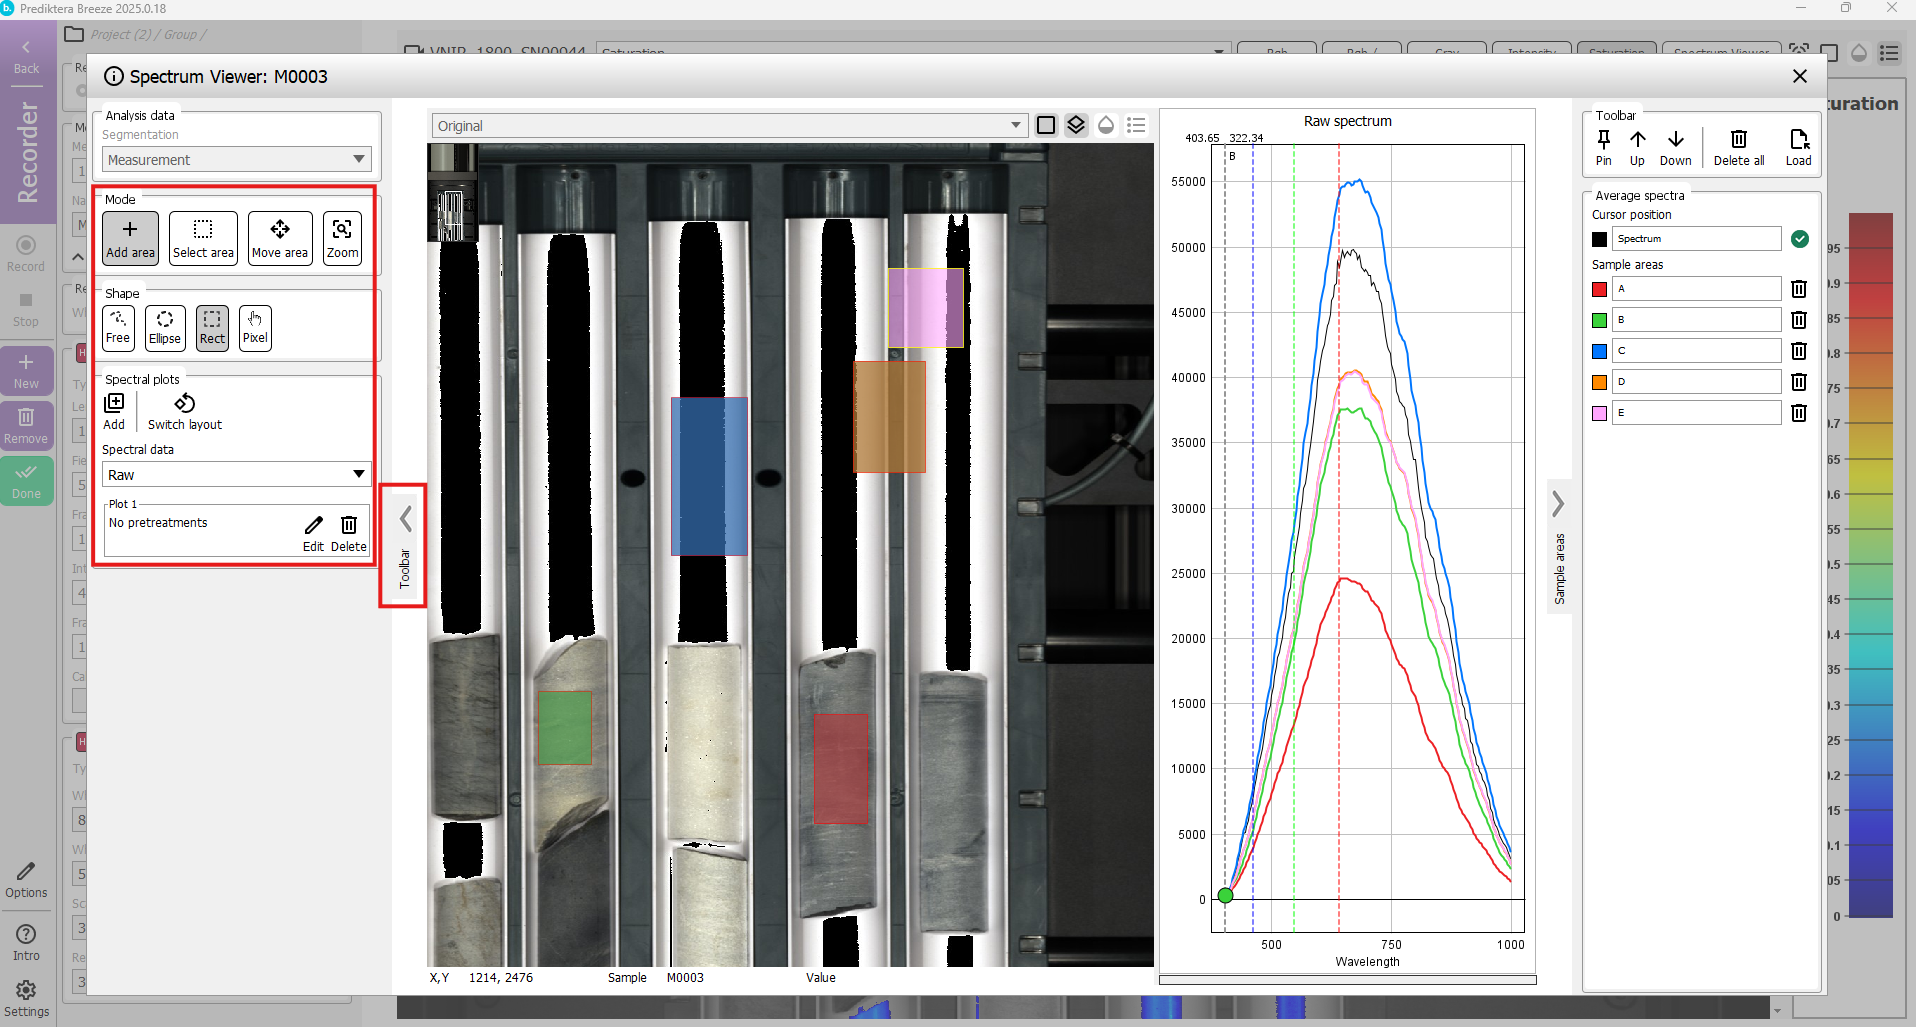
Select the Spectral Viewer button to view the captured image spectra.
If you move the mouse cursor around in the pseudo RGB image it will update the spectral plot and show the spectrum for each pixel. If you hold down left mouse button, you can select areas and view and compare the average spectrum for each area.
On the left side of the screen there is a tool bar with tools for selecting areas and adding spectral plots.
You can also select to view the spectra as raw or converted to radiance, reflectance or absorbance (if there is a white ref).
If you are happy with your captured image, you can close Spectral Viewer and then:
Press the “New” button to record another image (the previous image has already been saved).

Press “Remove” button to delete the current measurement (if you do not want to keep it).

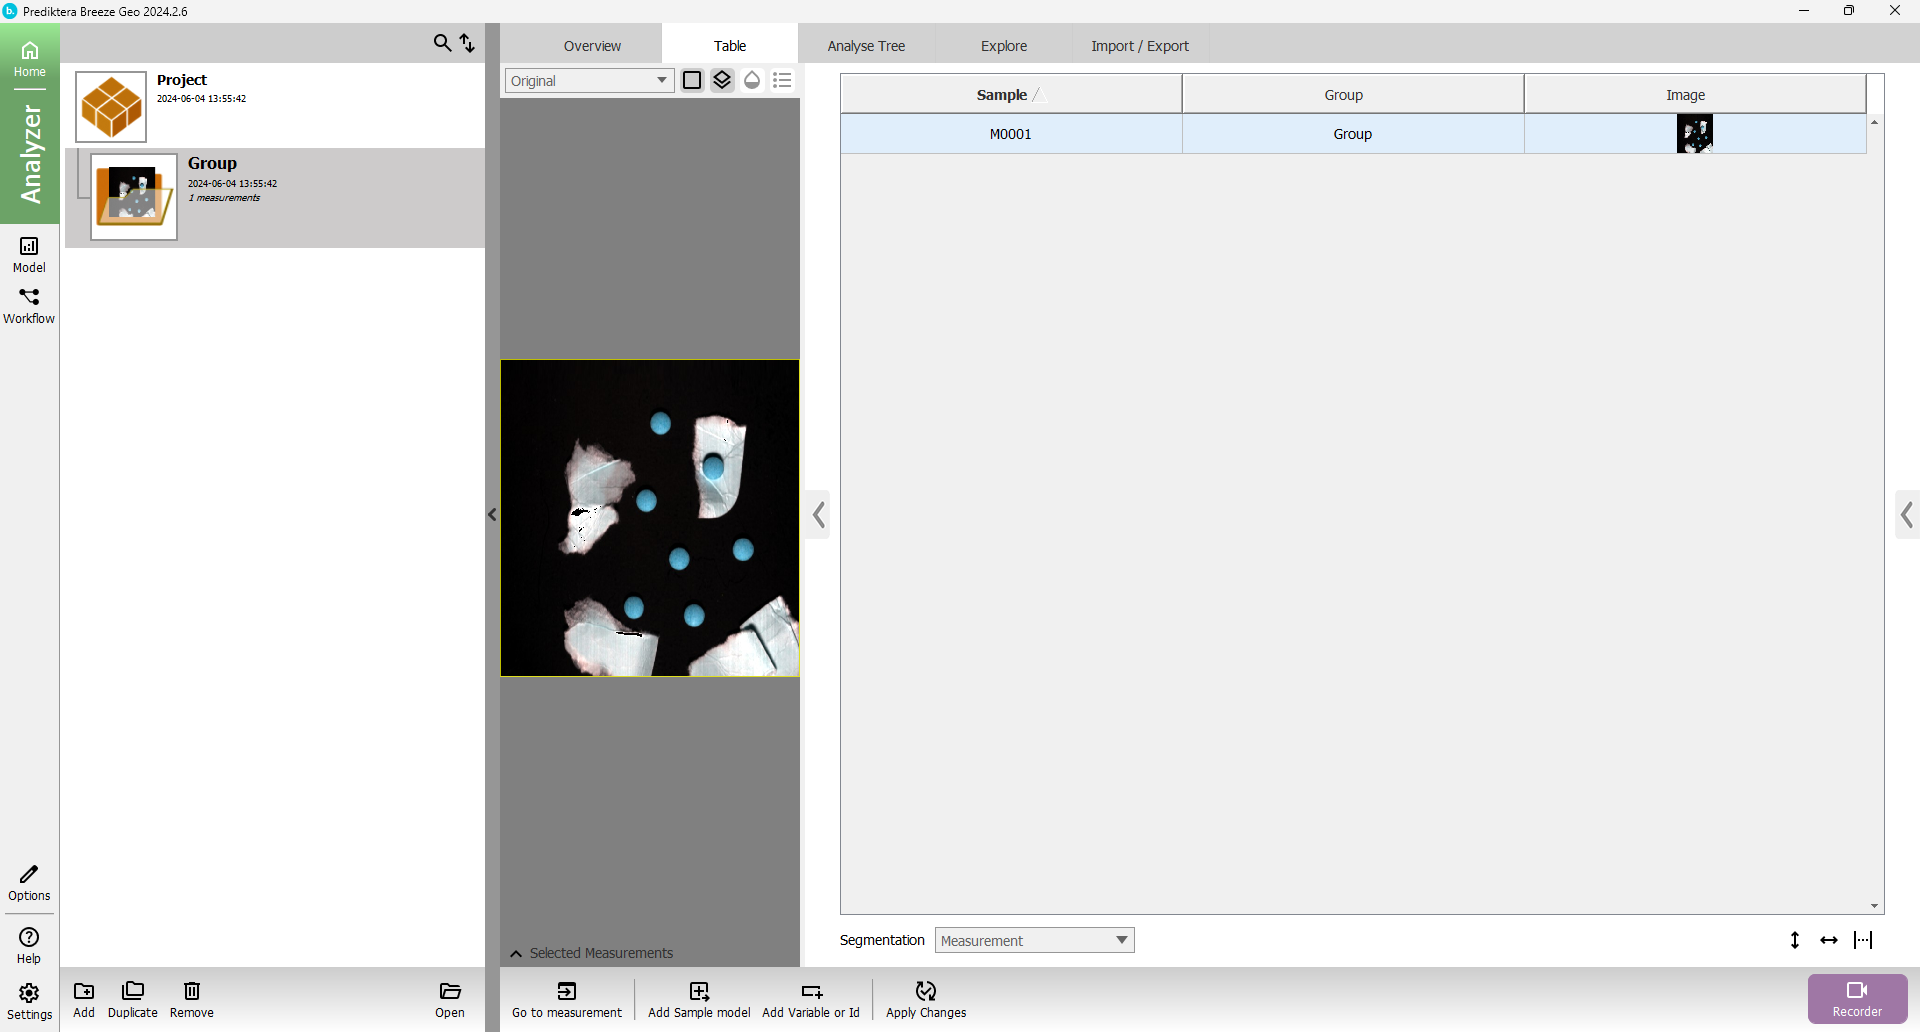
Press “Done” to leave the data capturing view and go to the Analyzer view.
Here you can see all the images you have recorded in your project.

The recorded images are located on disk under the workspace folder:
{workspace folder}\Record\{project name}\{group name}

You can make several workspaces and switch between them depending on where you want to store our data.
Right click on the measurement select “Open in File Browser” to access the file.
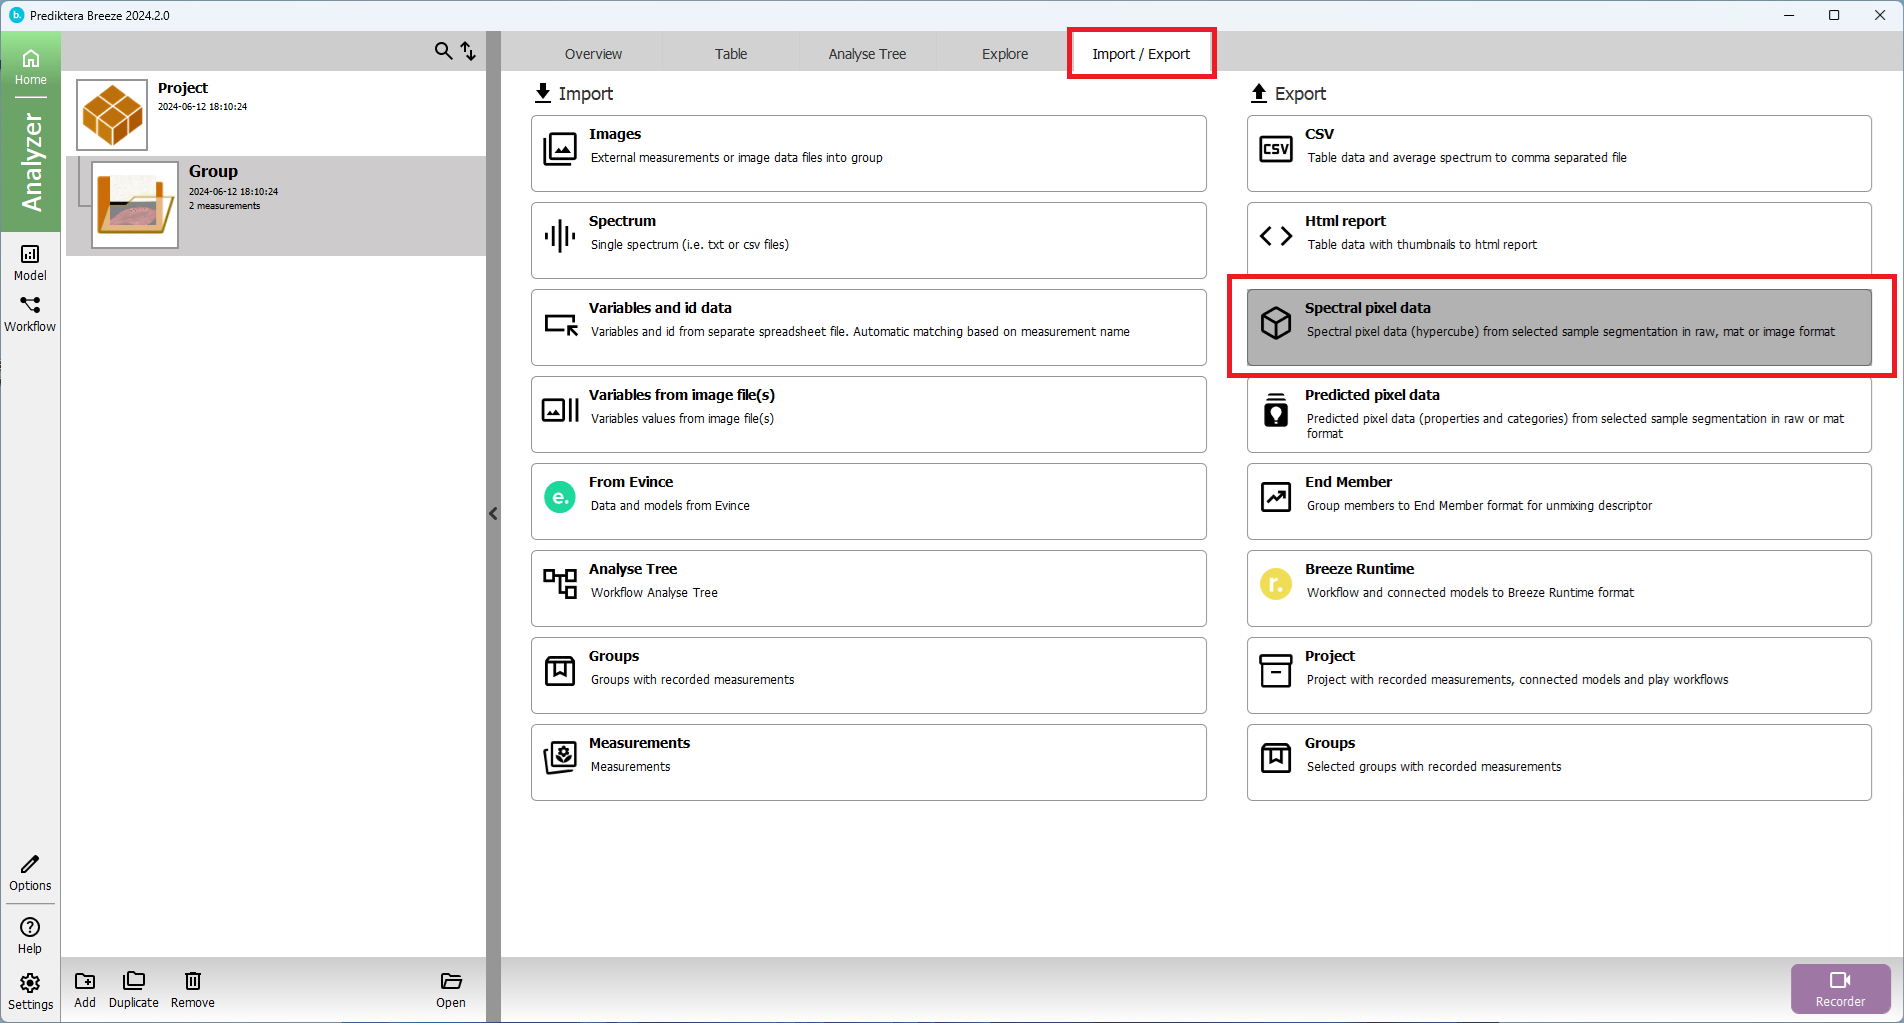
You can export your work by pressing the “Import/Export” button. Then press the spectral pixel data to get the spectral pixel data (hypercube) from the selected sample segmentation in Raw, Mat or image format.
Great job completing the guide! We hope you've enjoyed using the software.