Spectrum Viewer enables quick viewing of very large images. Interactively compare hyperspectral data between parts of an image. Spectrum Viewer is available as a tab for measurements in Breeze, but also comes as a stand-alone program that can be used without Breeze as a general purpose hyperspectral image viewer and editor with export functionality to Radiance, Reflectance and Absorbance spectral formats.
Features of Spectrum Viewer
Spectrum Viewer is similar to the Pixel Explore functionality in Breeze, but optimized to handle very large images, because the full hyperspectral data for the image isn’t loaded in to memory..
Core features are:
-
Full-resolution pseudo-RGB display of three changeable wavelengths of the image with zoom and pan functionality
-
Built in handling of dark and white references
-
Switch between spectral modes to view data in Reflectance, Absorbance and Radiances and Raw format, when reference data is available.
-
Interactive spectral analysis:
-
live hyperspectral data visualized in plots for the mouse cursor position and for manually created samples created in the image
-
create, move, edit, color and name samples as you like.
-
Save spectral data for sample areas to file in various formats. Can also be used as end members Create end members .
-
Load and compare with previously saved spectra.
-
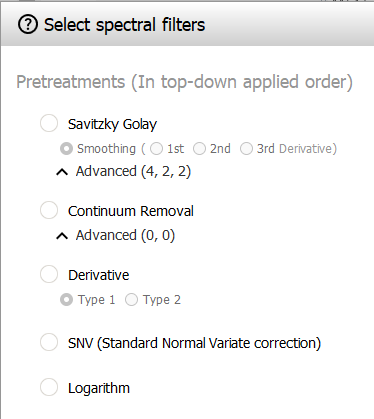
apply spectral filter preprocessing to the plotted data: savitsky golay, continuum removal, derivative, SNV, logarithm
-
-
Visualize data from Breeze predictions when it is available (in the
measurement_prediction.rawfile in the image’s folder):-
add samples from the Breeze measurement to Spectrum Viewer to explore the spectral data for the objects
-
switch between different segmentation levels, and descriptors used in the analyses
-
Features unique to the Spectrum Viewer tab in Breeze
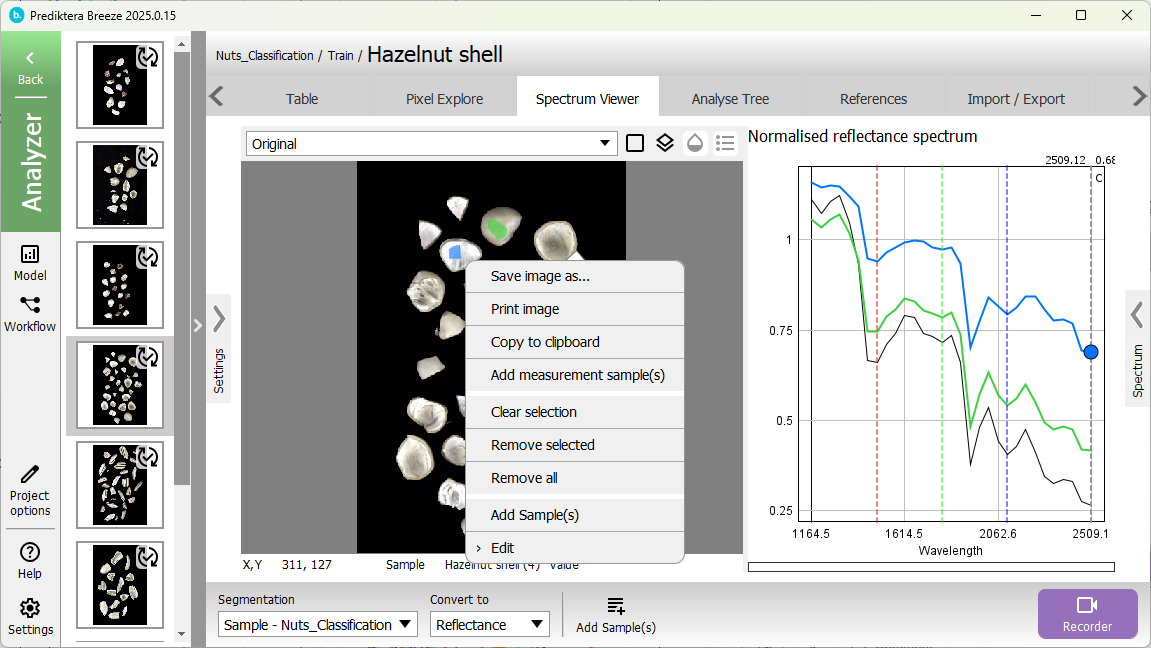
This is how the Spectrum Viewer tab looks for a measurement in Breeze, and the available commands in the right-click context menu:
-
Switch segmentation level and the spectral mode at the bottom.
-
Use Add Sample(s) button or context menu command to create samples in the Breeze Table from the selections you made in Spectrum Viewer, to analyze them further in Breeze.
Learn how to use the Spectrum Viewer main window at the end of this page.
Manipulating references or editing the image is not available on the Spectrum Viewer tab in Breeze, but these features are available in other tabs for a measurement. Editing images .
Features unique to the stand-alone Spectrum Viewer app
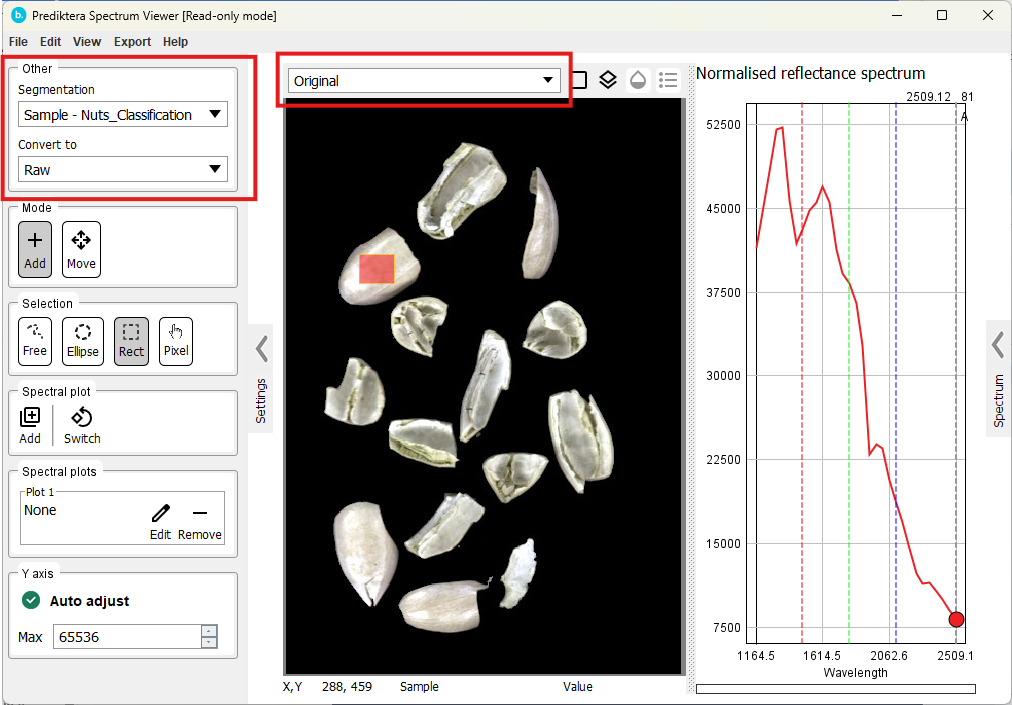
The Spectrum Viewer app is started from from Windows Start, or directly from the Breeze program folder. It looks like this:
You can start more than one Spectrum Viewer at the time, to look at many images at the time.
-
If the data comes from Breeze, you can switch Segmentation level and visualize data from different parts of the Analysis Tree in the upper left of the Settings pane.
-
Below it, you use Convert to to switch between spectral modes.
Use the main menu commands:
-
File > Open to load any supported file format directly from disk: ENVI Files (bil, bip, bsq, raw, img, bin, dat, envi), HySpex Files (hyspex). When you open an image, Spectrum Viewer will look for dark and white references in the same folder as the image and load those as well.
-
View > References. View information on the Dark and White References associated with the image.
-
Edit > Enable editing. Spectrum Viewer is read-only by default to not risk overwriting an original image. Enabling editing lets you:
-
Set the wavelengths used for the pseudo RGB visualization
-
Import references or extract from part of the image
-
Crop image , rotate or transform the image in other ways as described in Editing images
-
-
Export:
-
Open the image in Prediktera’s Evince software, if it is installed. This is not recommended for very large images.
-
Export the file as a new file with spectral formats Raw, Reflectance, Absorbance, or Radiance Spectral imaging formats.
-
Learn how to use the Spectrum Viewer main window at the end of this page.
You can make Spectrum Viewer the default app that opens when you double-click image files in Windows. Learn more below.
Command line parameters
Spectrum Viewer can be launched and open a measurement on the command line. The syntax is:
SpectrumViewer.exe fullPathToImage
For example, to start Spectrum Viewer from the default installation location and open one of the measurements from the Breeze tutorial data from a folder on disk this command can be used:
"C:\Program Files\Prediktera\Breeze\SpectrumViewer.exe" "C:\data\BreezeTutorials\Record\Nuts_Classification\Train\Pecans shell\measurement.raw"
How to make Spectrum Viewer the default app in Windows for image files
To enable double clicking on a RAW file in File Explorer (or any other supported file type), and automatically opening Spectrum Viewer, do as follows:
In File Explorer in Windows:
-
Right-click any file with the
.RAWextension. -
Select Open with → Choose another app.
-
Click More apps, then Look for another app on this PC.
-
Browse to the
SpectrumViewer.exein the Breeze program folder (see previous section) and select it. -
Check Always use this app to open .abc files.
-
Click OK.
Using the Spectrum Viewer: guide to the user interface
This section describe how to use the main window of the Spectrum Viewer.
If your window doesn’t look like the below screenshot you can expand and collapse or expand panes as needed by clicking the < and > buttons.

The main parts of the window are describe below:
The Settings pane to the left
This pane has buttons for
-
Control if samples are added or moved when you click and drag in the image.
-
Switch mouse click-and-drag selection mode between freeform, ellipse, rectangle
-
Adding plots or switching layout
-
Add spectral filters in plots by clicking the Edit button:
-
Specifying the max Y-axis value to scale plots vertically
The pseudo RGB image visualization
The middle part shows the image as a pseudo RGB image, showing three hyperspectral band selected from the image.
-
Use the drop-down above the image to switch between descriptors used in the Analysis Tree
-
Use the mouse wheel to zoom in the image. Middle-click and drag to pan in the zoomed in image.
-
Click and drag to select samples. Use the Settings pane to control if free form, ellipse or rectangular selection are used.
-
Provide a name and color for the sample, and it appears in the Sample pane to the right (see below). Tip: Hold down Ctrl and click and drag to bypass the name dialog, and quickly create many samples.
-
The average spectra for all pixels in the samples are visualized in the plots, and the sample appears in the right Samples pane.
-
-
-
Switch to the Move mode in settings, and click an object and drag it to move it. The average spectra for the object will change and be visualized in the plots. This can be used as a easy way to average set of pixels and then examine parts of the original image.
-
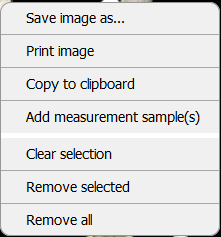
Right-click shows the context menu:
-
Select Add measurement sample(s) to add any samples for this image from the Breeze Table as samples in Spectrum Viewer
-
Remove selected and Remove all removes samples from the image
-
Change bands in the context menu.
-
-
Below the image the current mouse cursor position is displayed, and the sample name and value for the selected descriptor (when applicable)
If you work with a very large image, do not select a too large part of it, as it requires loading everything into memory.
Spectral plots
Each plot is a scatter plot visualizing the spectral data. Data is visualized for the current mouse cursor position as well as the average spectrum for each sample you have created.
Use the mouse wheel to zoom.
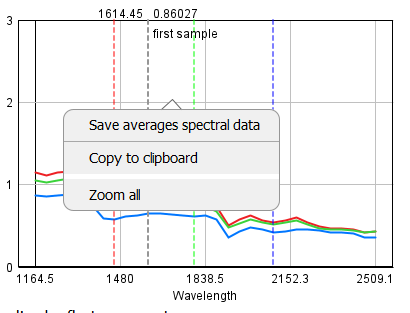
Right-click to show the context menu to zoom out or to save the spectra in the plot as a file. This file can later be loaded in the Samples pane.
You can add more plots using the Settings pane.
The Samples pane to the right
The samples pane shows a list of all samples visualized in the image.
-
Toggle the live display of the cursor position
-
Edit sample names in the list. Change color by clicking it..
-
Re-order samples by using the toolbar button
-
Pin samples to keep them in the plots, even if you clear (remove all) other objects from the image, or if you switch to view data for a different image.
-
Load samples from file, for example as a reference for comparison.