HySpex Breeze Recorder Software Guide

Welcome to this guide on using HySpex cameras and scanners with the Breeze Recorder software. This guide provides easy-to-follow instructions for connecting, setting up, and recording data.
You'll learn how to:
-
Install Breeze Recorder software
-
Connect to your HySpex camera and scanners
-
Configure the settings for your HySpex camera and scanners
-
Capture data
-
Viewing your captured data and check the spectra
-
Manage and analyse your data efficiently
Follow these steps to enhance your hyperspectral imaging projects with ease. Let's get started!
Breeze Record installation guide
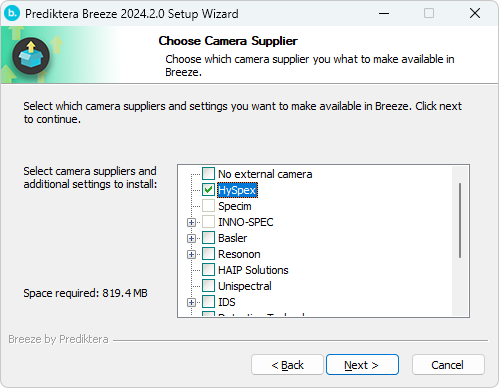
Install Breeze
Select HySpex camera in supplier list in the installation wizard for Windows
Connect to HySpex camera
These instructions assumes that all hardware components have been physically connected and turned on.
Start Breeze
The start menu should look like this
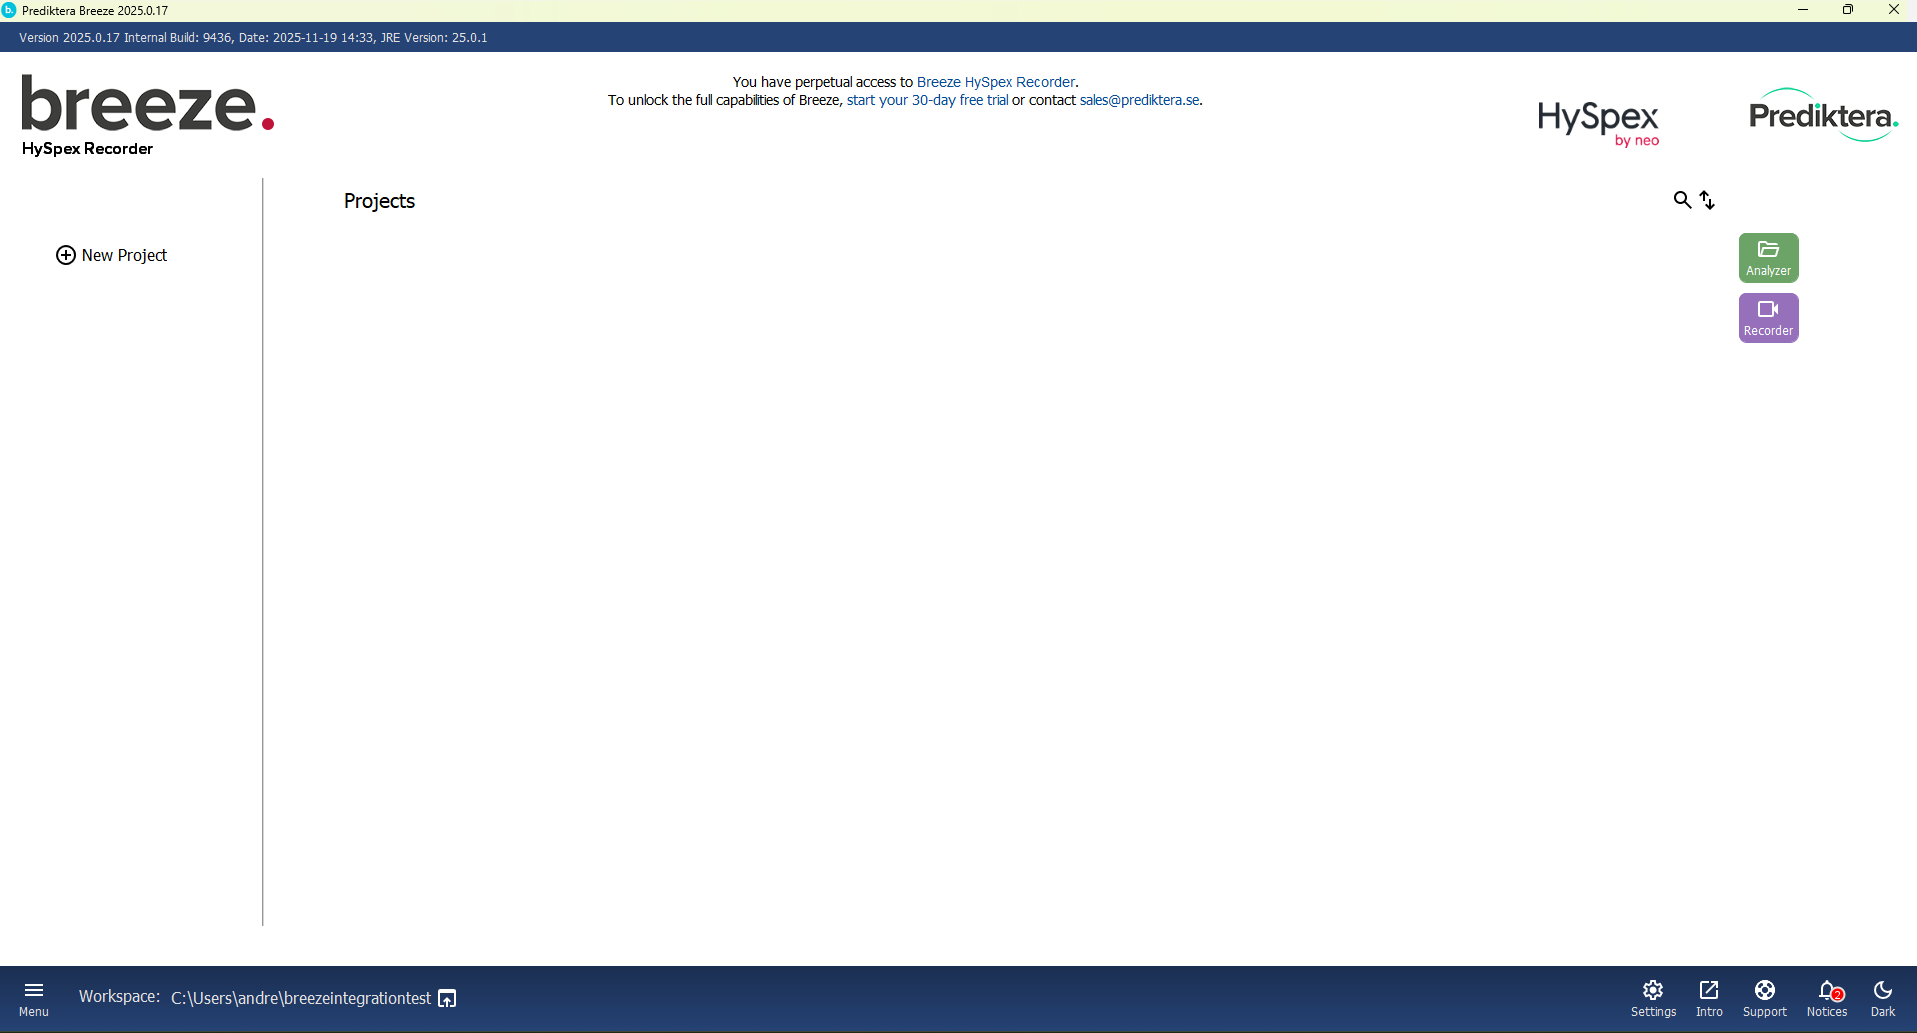
To configure the settings of your camera and scanner, press the “Settings” button.
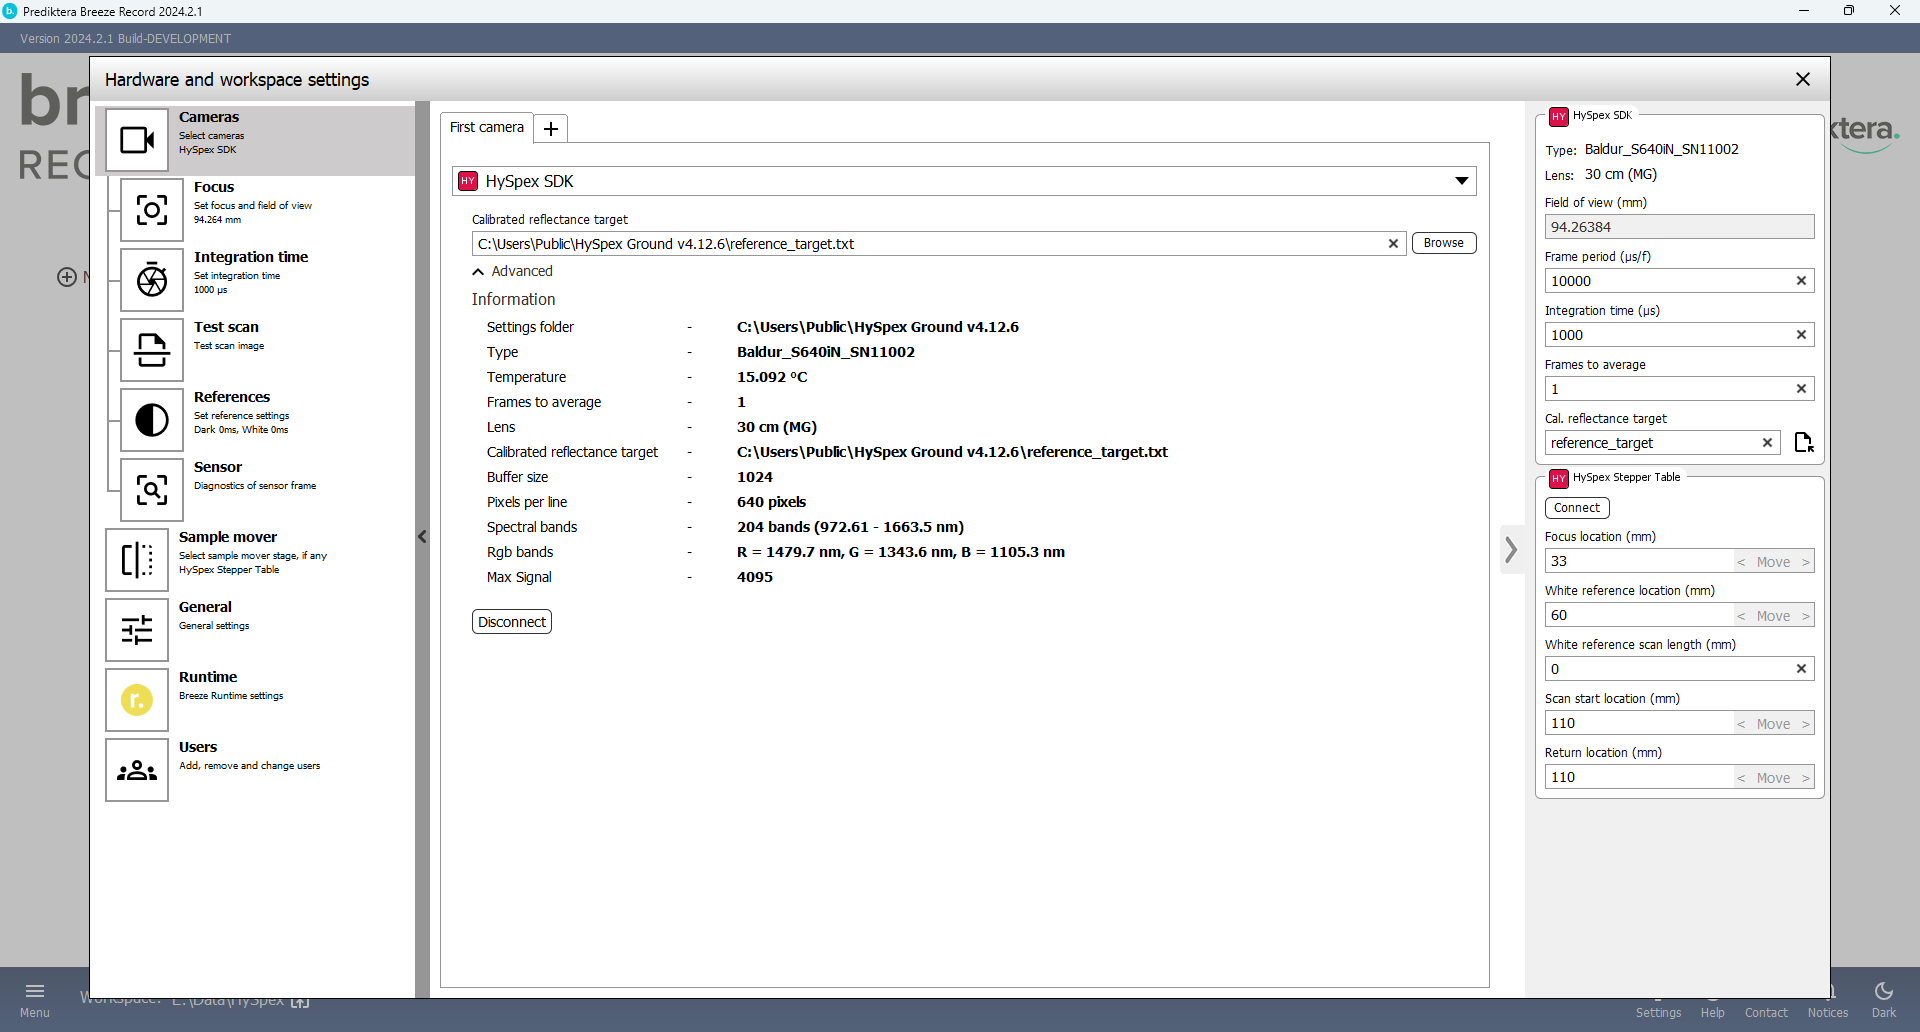
Under “Cameras” and “First camera” open the drop-down menu and select “HySpex SDK”.
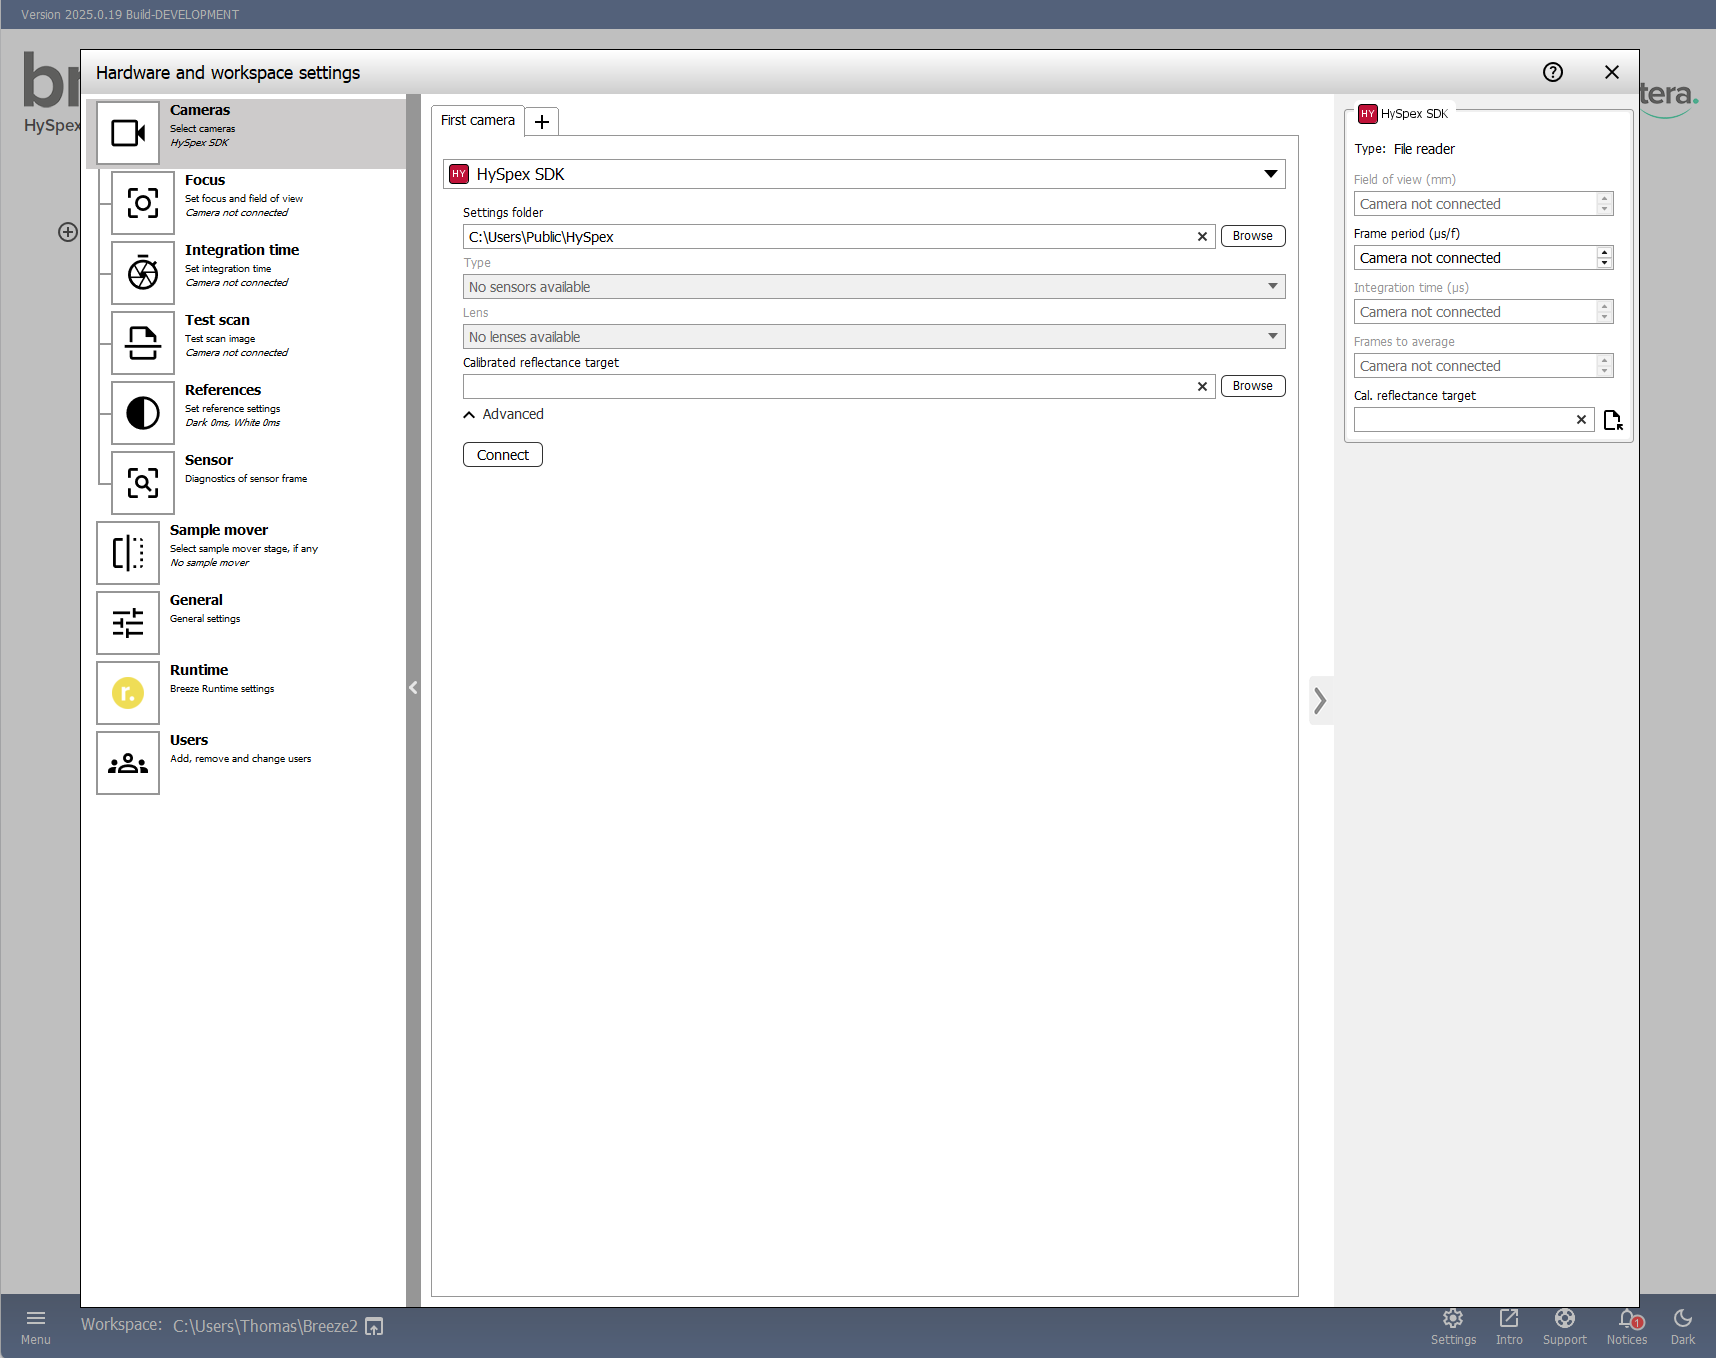
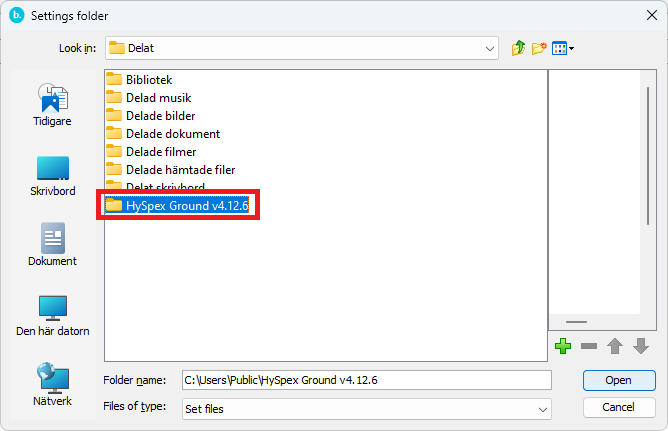
After you have selected the HySpex SDK, you need to find the HySpex Ground folder. Press the “Browse” button to the right of the “Settings folder”.
Locate the HySpex Ground folder. If you have purchased a computer from HySpex with the camera setup the folder is usually located on the desktop of the computer. When you have located the folder press “Open”.
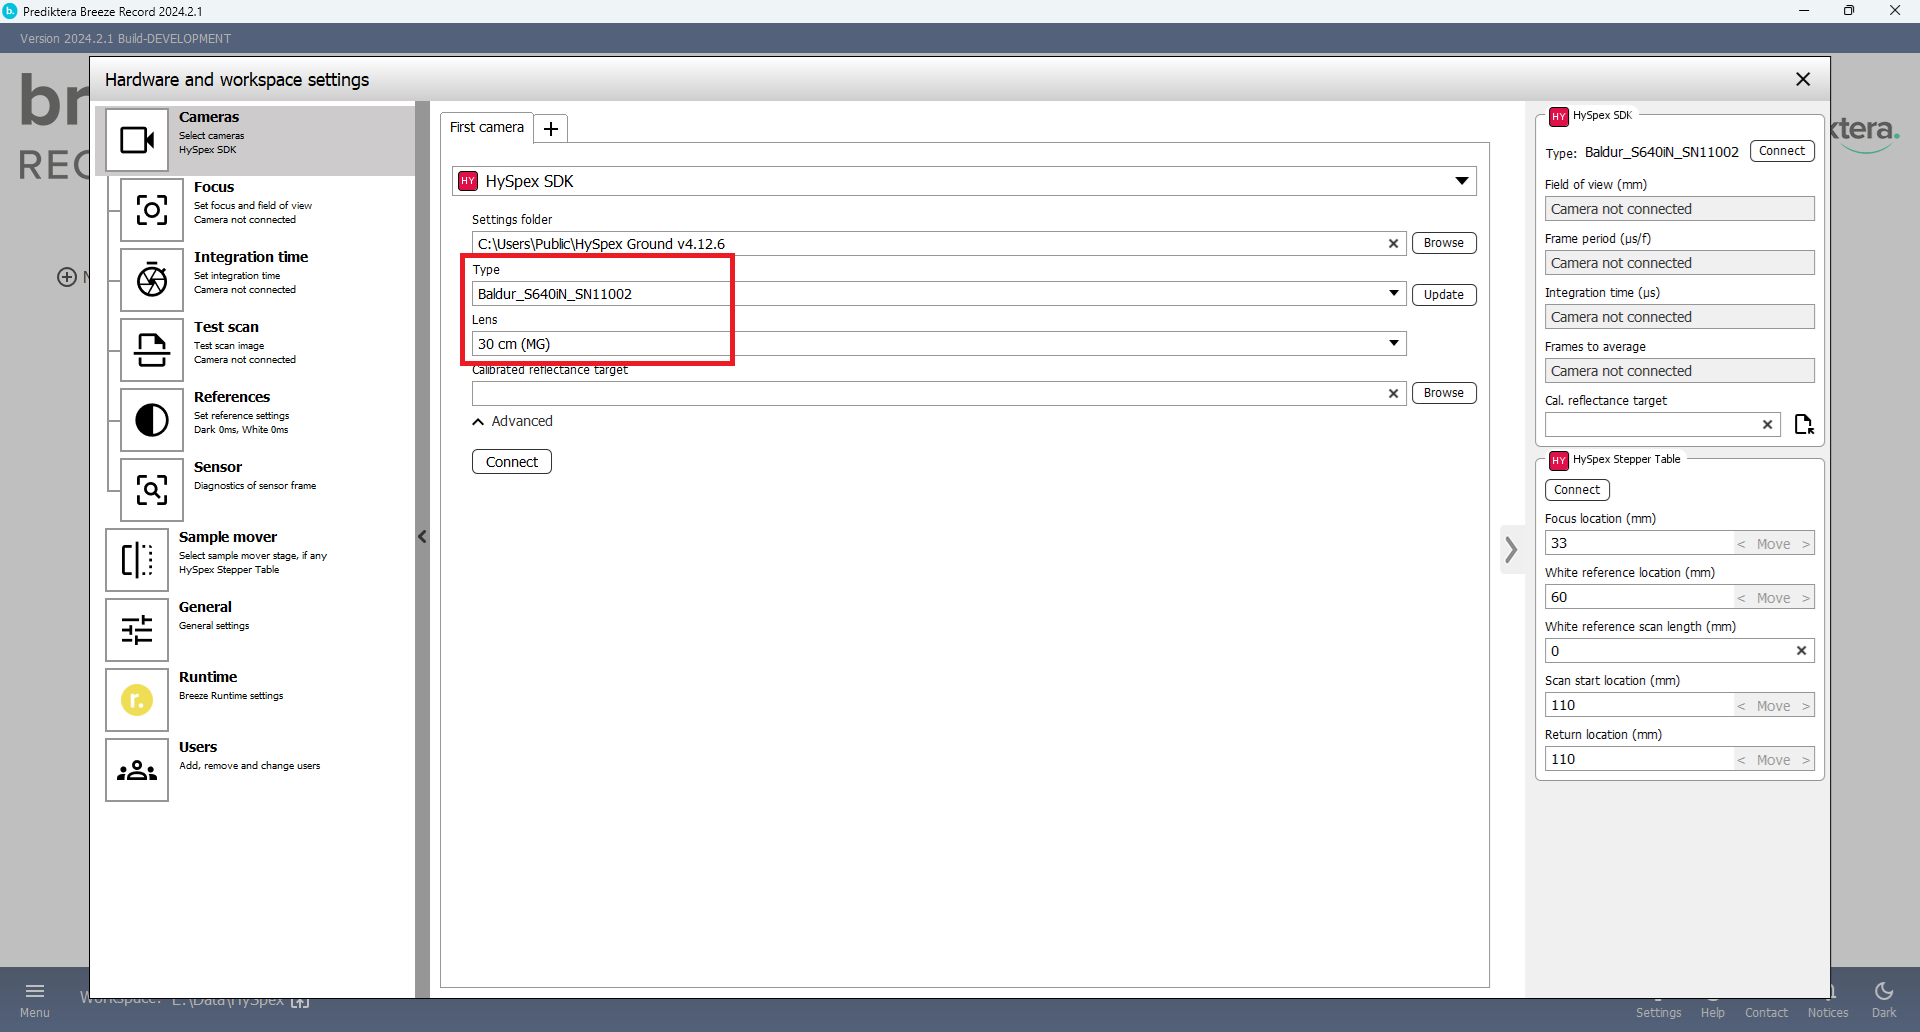
Wait until the camera has been found. You should then see the name of your camera under “Type” (If you have more then one camera turned on and connected you can press the drop-down menu to see the different cameras).
In “Lens” you can select which type of lens you have attached to the camera.
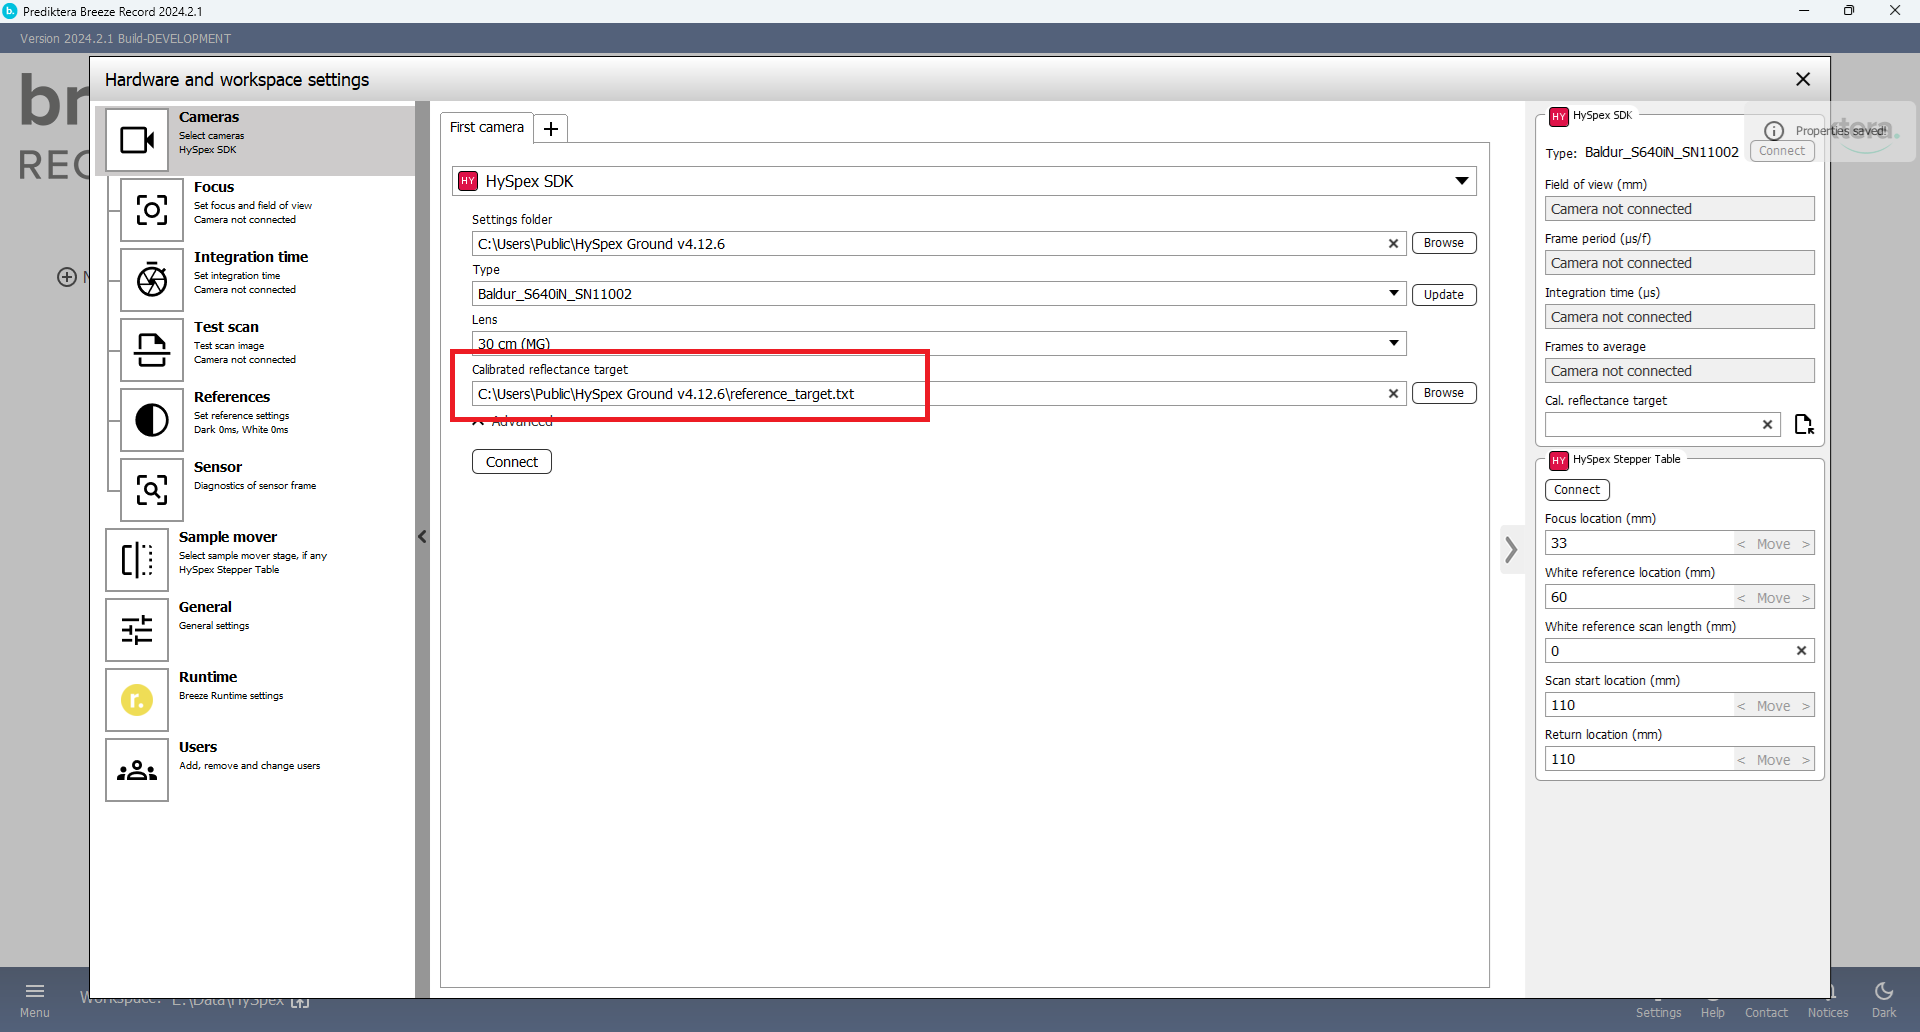
In “Calibrated reflectance target” select the calibration file for the reference target (white/gray reference) you will be using.
Press the “Connect” button.
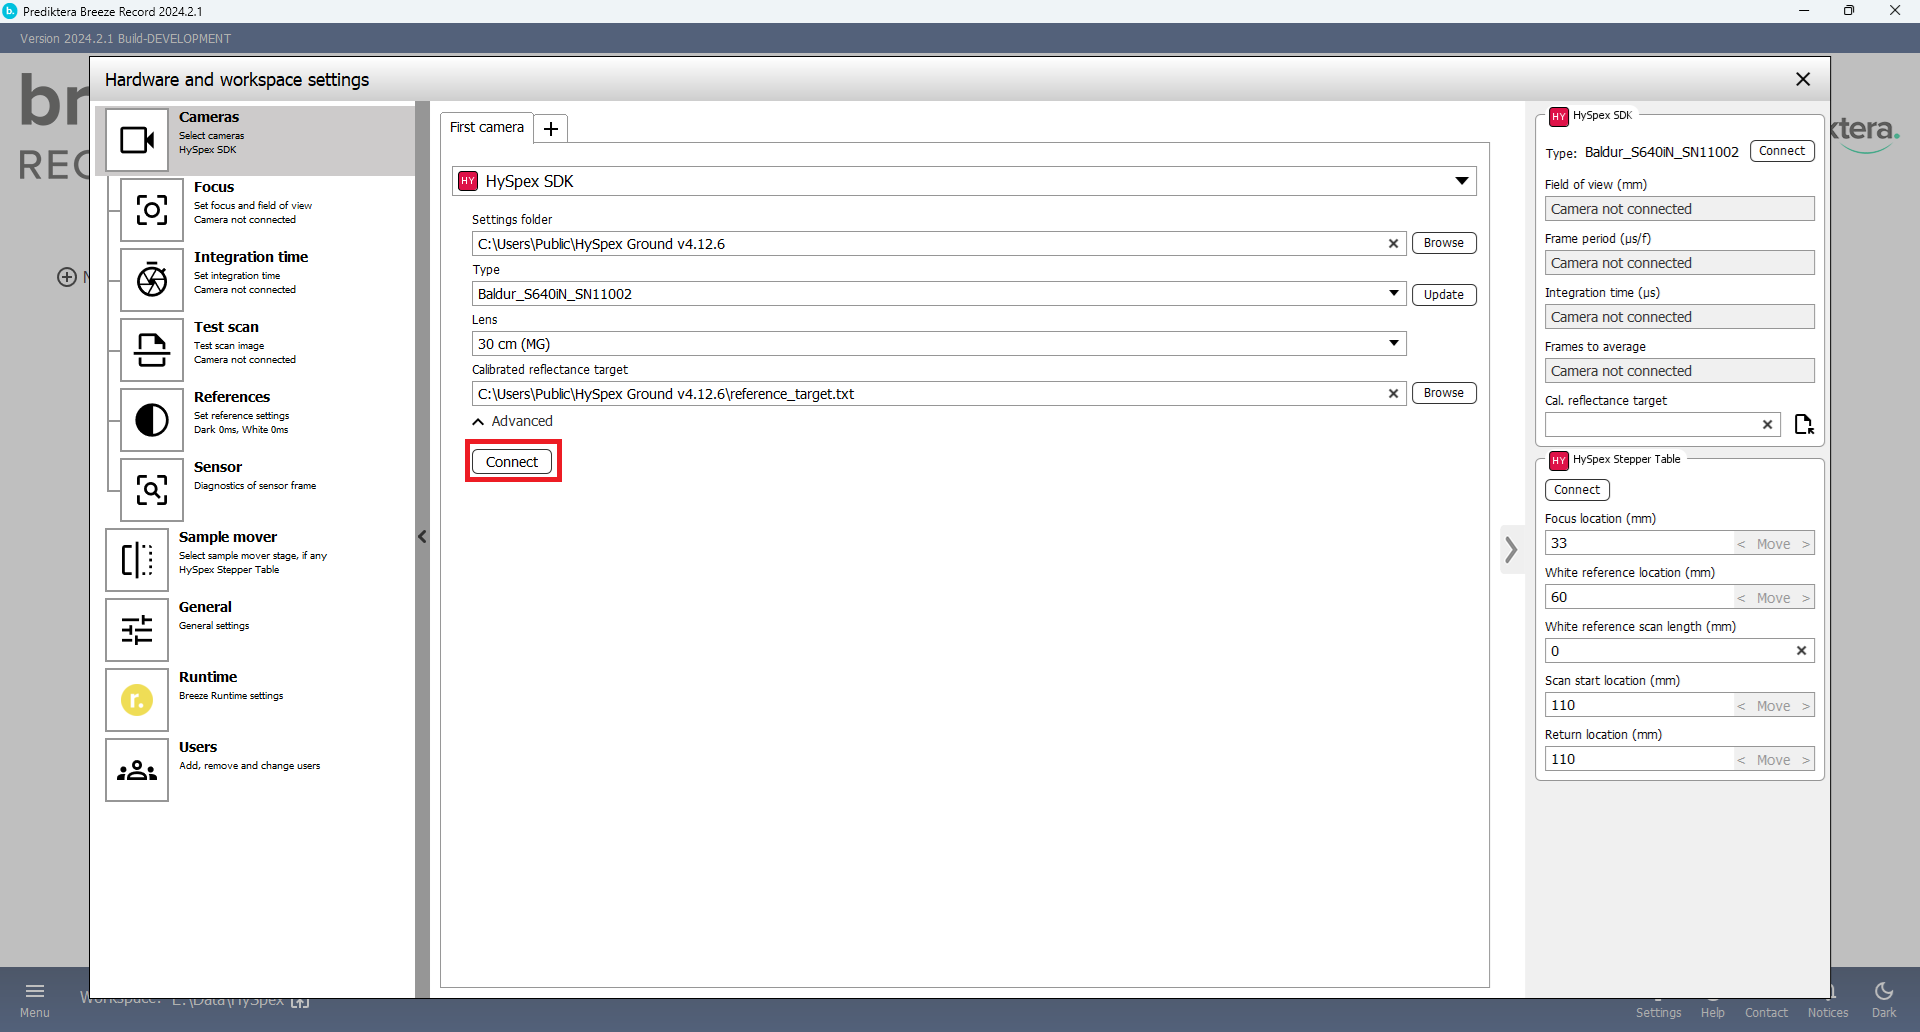
If you connected successfully you should see the camera information.
Connecting scanner table
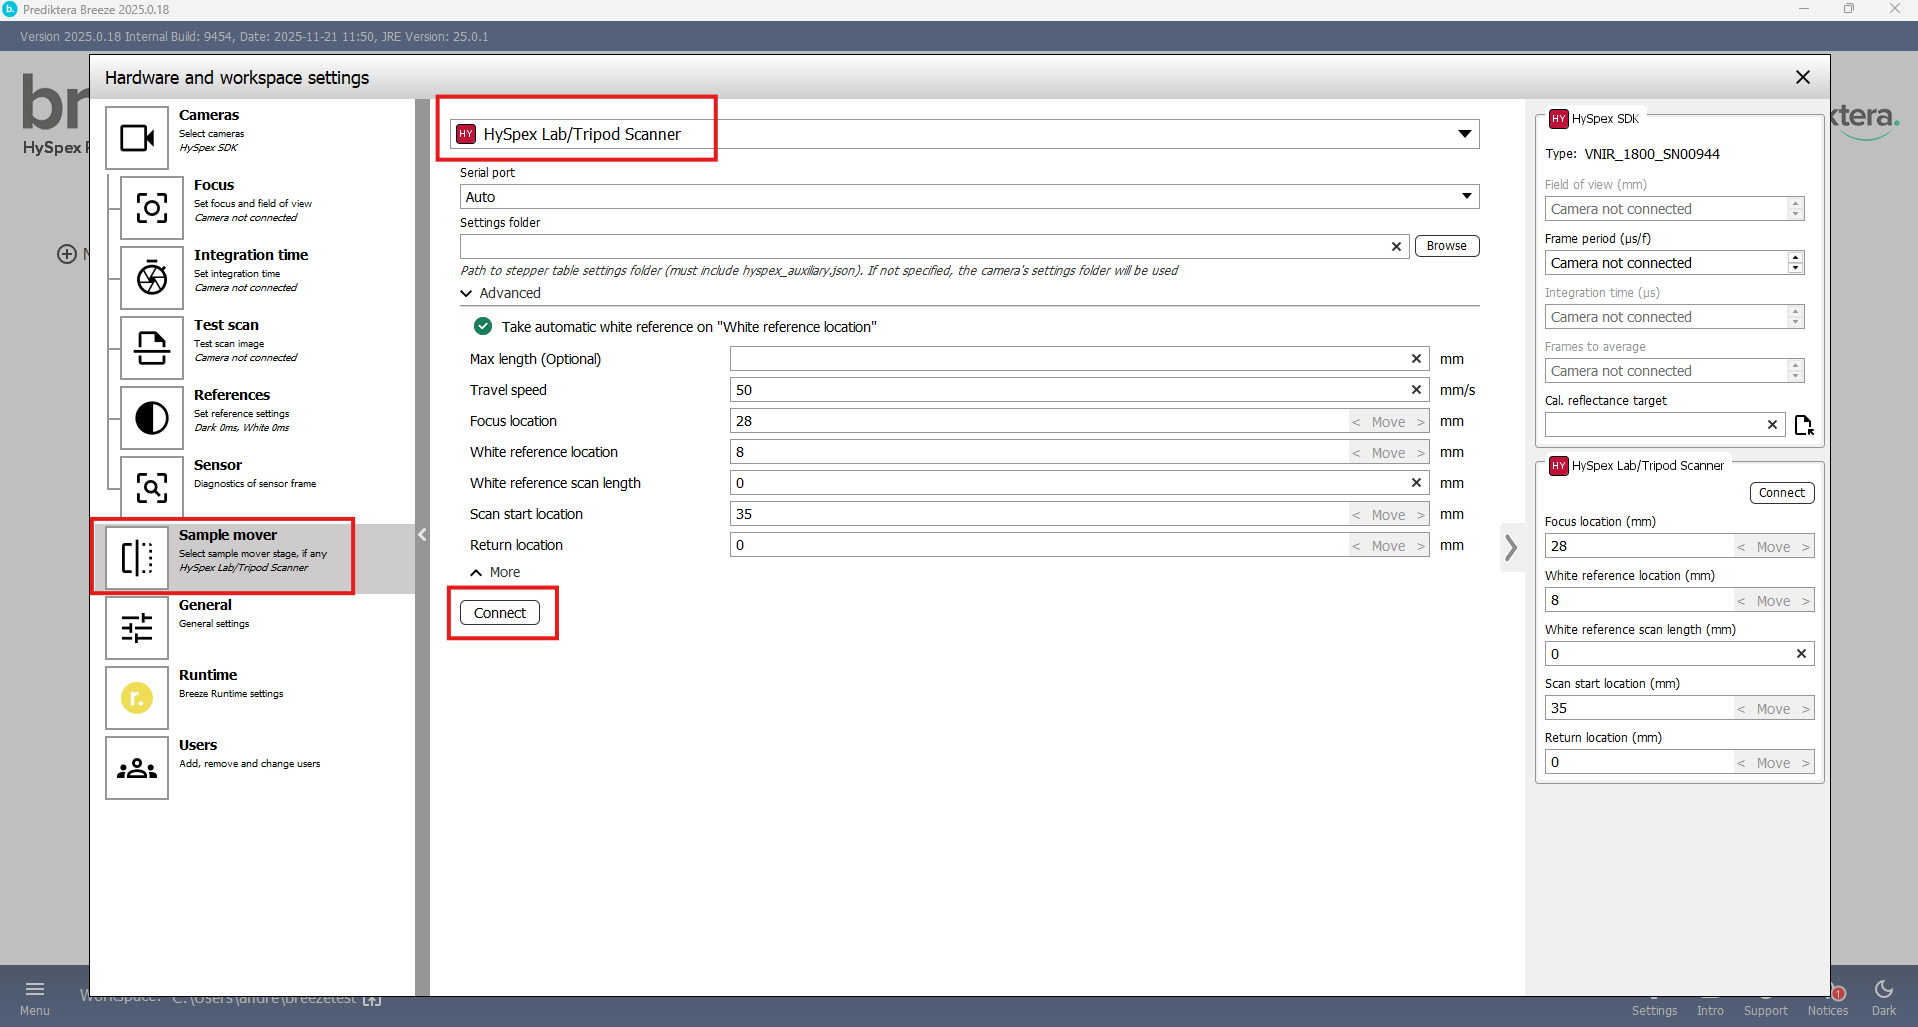
Under “Sample Mover” press the drop-down menu and select “HySpex Lab / Tripod Scanner”
Then press “Connect”.
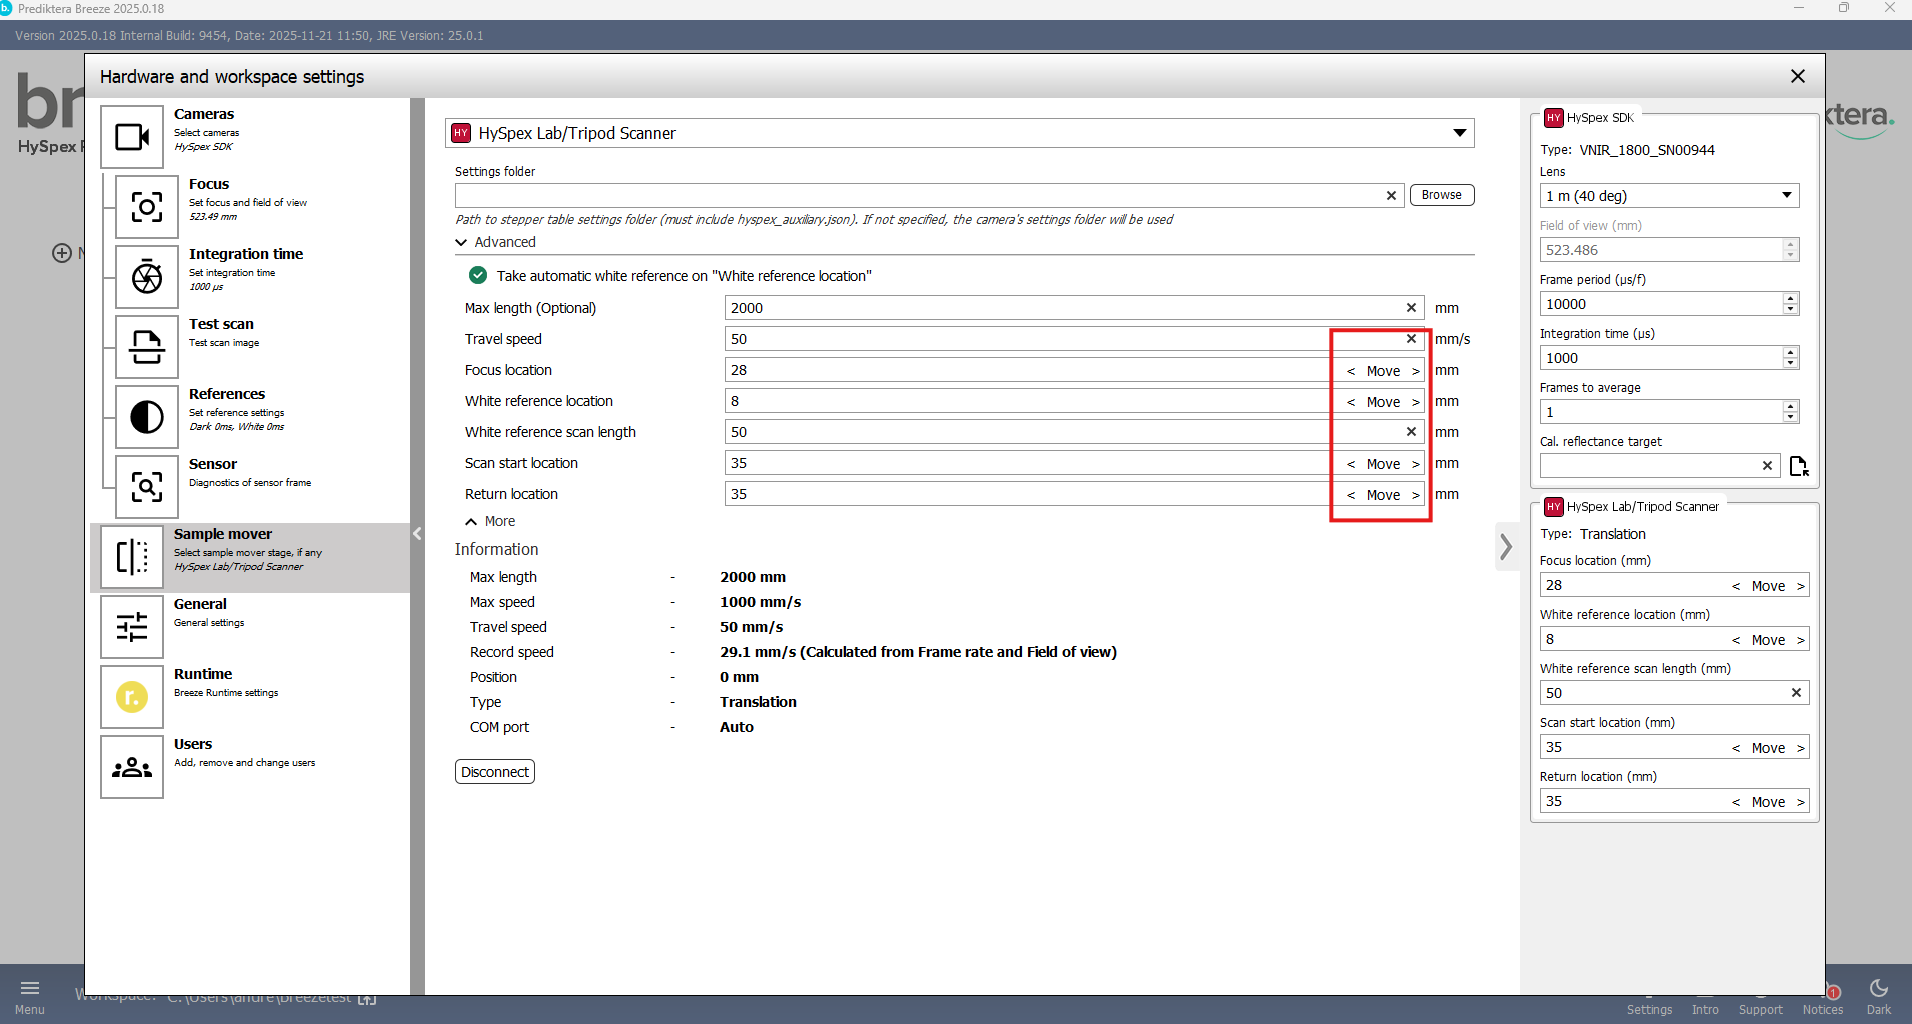
Under “Advanced” you can set different locations on the table.
-
Focus location (Optional) - Position of a focus grid that can help adjust the focus.
-
White reference location (Optional) - Location of the white reference target on the table. By checking the option “Take automatic white reference on “White reference location”, it will go to the set position to take a new white reference.
-
White reference scan length - How long you should measure the white reference in mm (Recommended around 50 mm)
-
Scan start location - Where Breeze Recorder should start the data acquisition on the table
-
Return location - The location where the table moves back to after recording (We recommended using the same for start and return location)
If you press the “Move to” buttons the table will move to the set location.
Connection troubles
If you have trouble connecting to either the cameras or the table, start by making sure all cables are firmly connected and the power is on. Make sure you do not have the “HySpex Ground” program open at the same time as Breeze. Close down and restart Breeze.
If you still have a problem connecting the camera. Close Breeze and start the HySpex Ground software. If you can't connect to the cameras in HySpex Ground contact HySpex support at hyspexsupport@neo.no.
If you can connect to the cameras and tables in HySpex Ground but not in Breeze, contact Prediktera Support at https://prediktera.com/support.
Follow this article for additional information on device configuration: Hardware and settings guide
Configure settings and take a test image
Focus
To ensure a sharp image it’s important that the focus is set correctly for the lens before data acquisition. To do this you can use a focus grid that is position at the same height as the highest point of the sample you will analyze.
TIP Download a focus sheet here: https://prediktera.com/download/pdf/Prediktera_Breeze_Focus_Paper.pdf
Go to “Settings” and “Focus”
The “Field of view” is the width of the image you can see in focus, specified in millimeters.
Turn on the light source.
Press “Camera” and press “Focus grid”. The scanner table will move to the position for the focus grid and the camera will start capturing data.
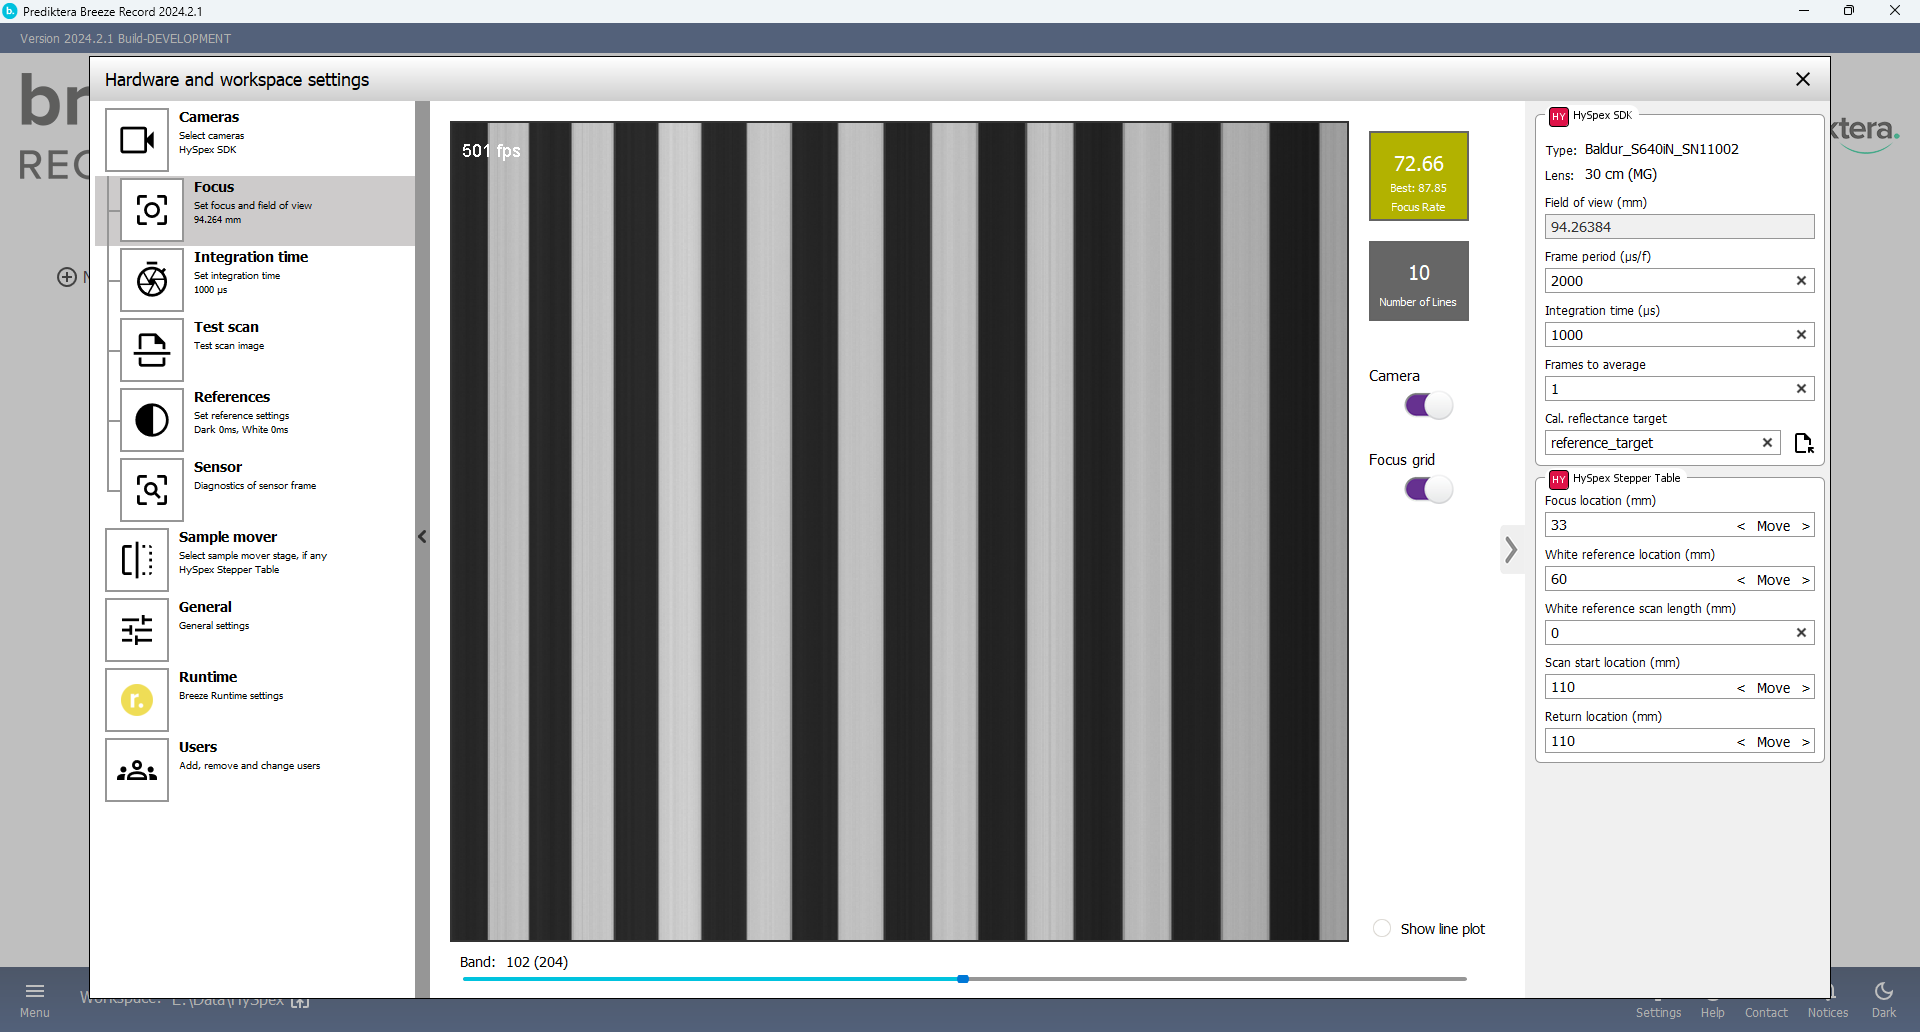
You can make use of the “Focus rate” value to get the best focus. Adjust manually the lens and until you reach the highest focus rate and the lines are sharp.
The “Line plot” can also help you to set the focus. Vertical lines will indicate a sharp image.
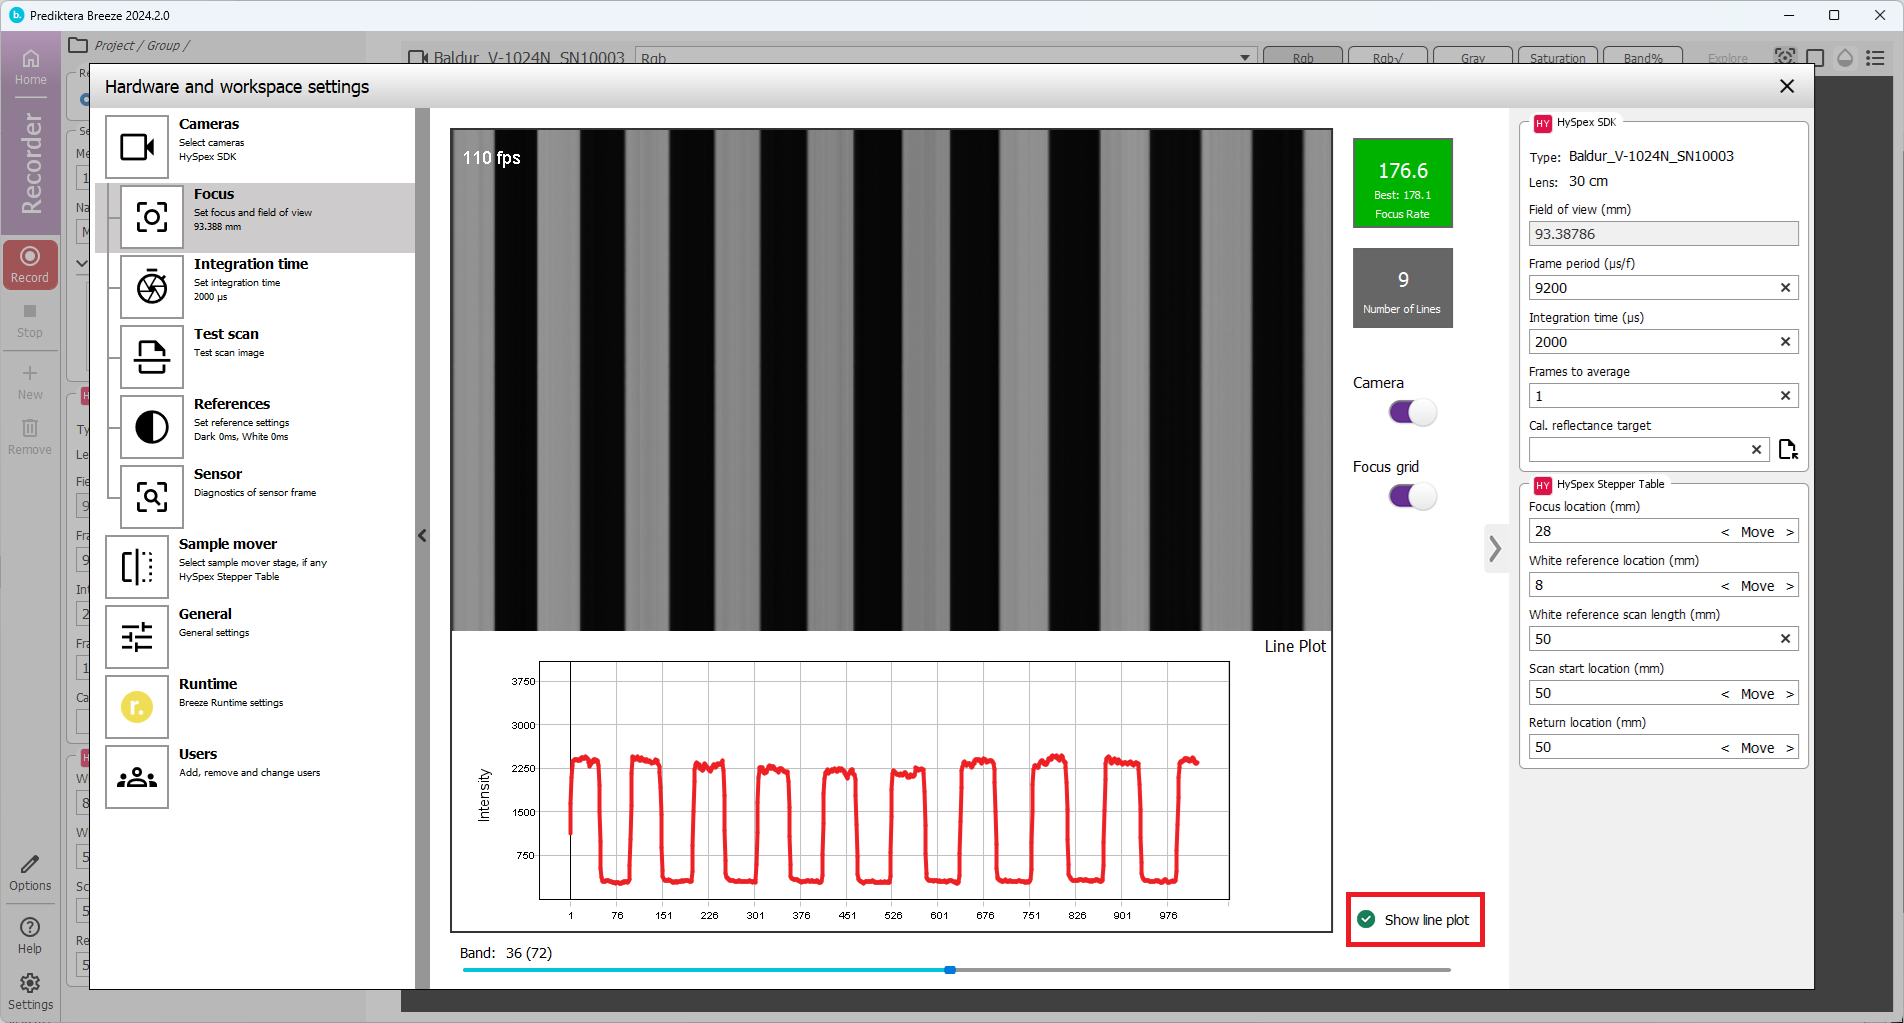
It’s optional to select different bands using the slider under the line plot.
Integration Time
Press the “Integration time” button on the left side panel
Adjust the Integration Time in the field on right side panel. Either scroll using the up and down arrows, or write the value and press enter on your key board.
You can use the spectral signal from the white/gray reference target to adjust the integration time.
Make sure the “Camera” button is selected.
Press the “Move to White reference” button. The table will move to the position that we set as the white reference location.
Place your reference target on the table in this location under the camera. Adjust the frame period and integration time to give the correct intensity for your reference target.
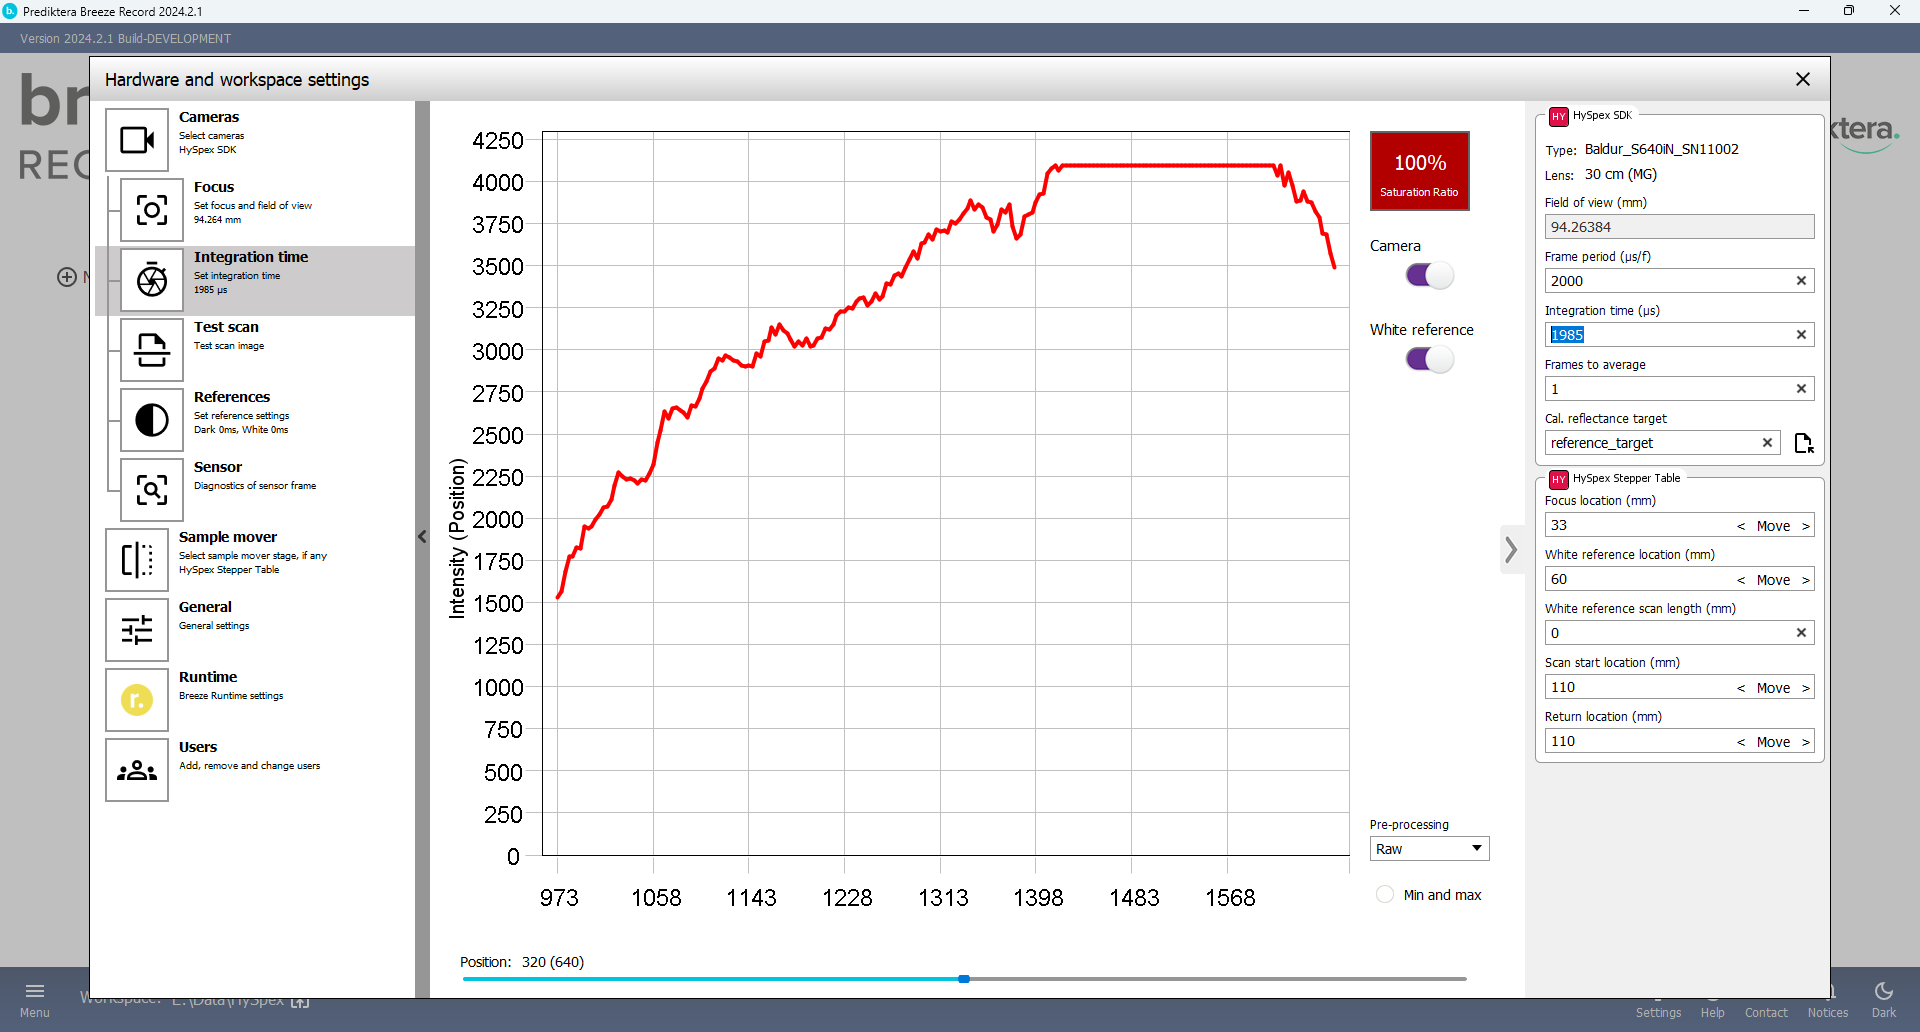
In the “Saturation ratio” square you can see the signal in % compared to the max signal that is possible for your camera. The background color in this square is red if the camera max signal is high or low, and green between 80-90%.
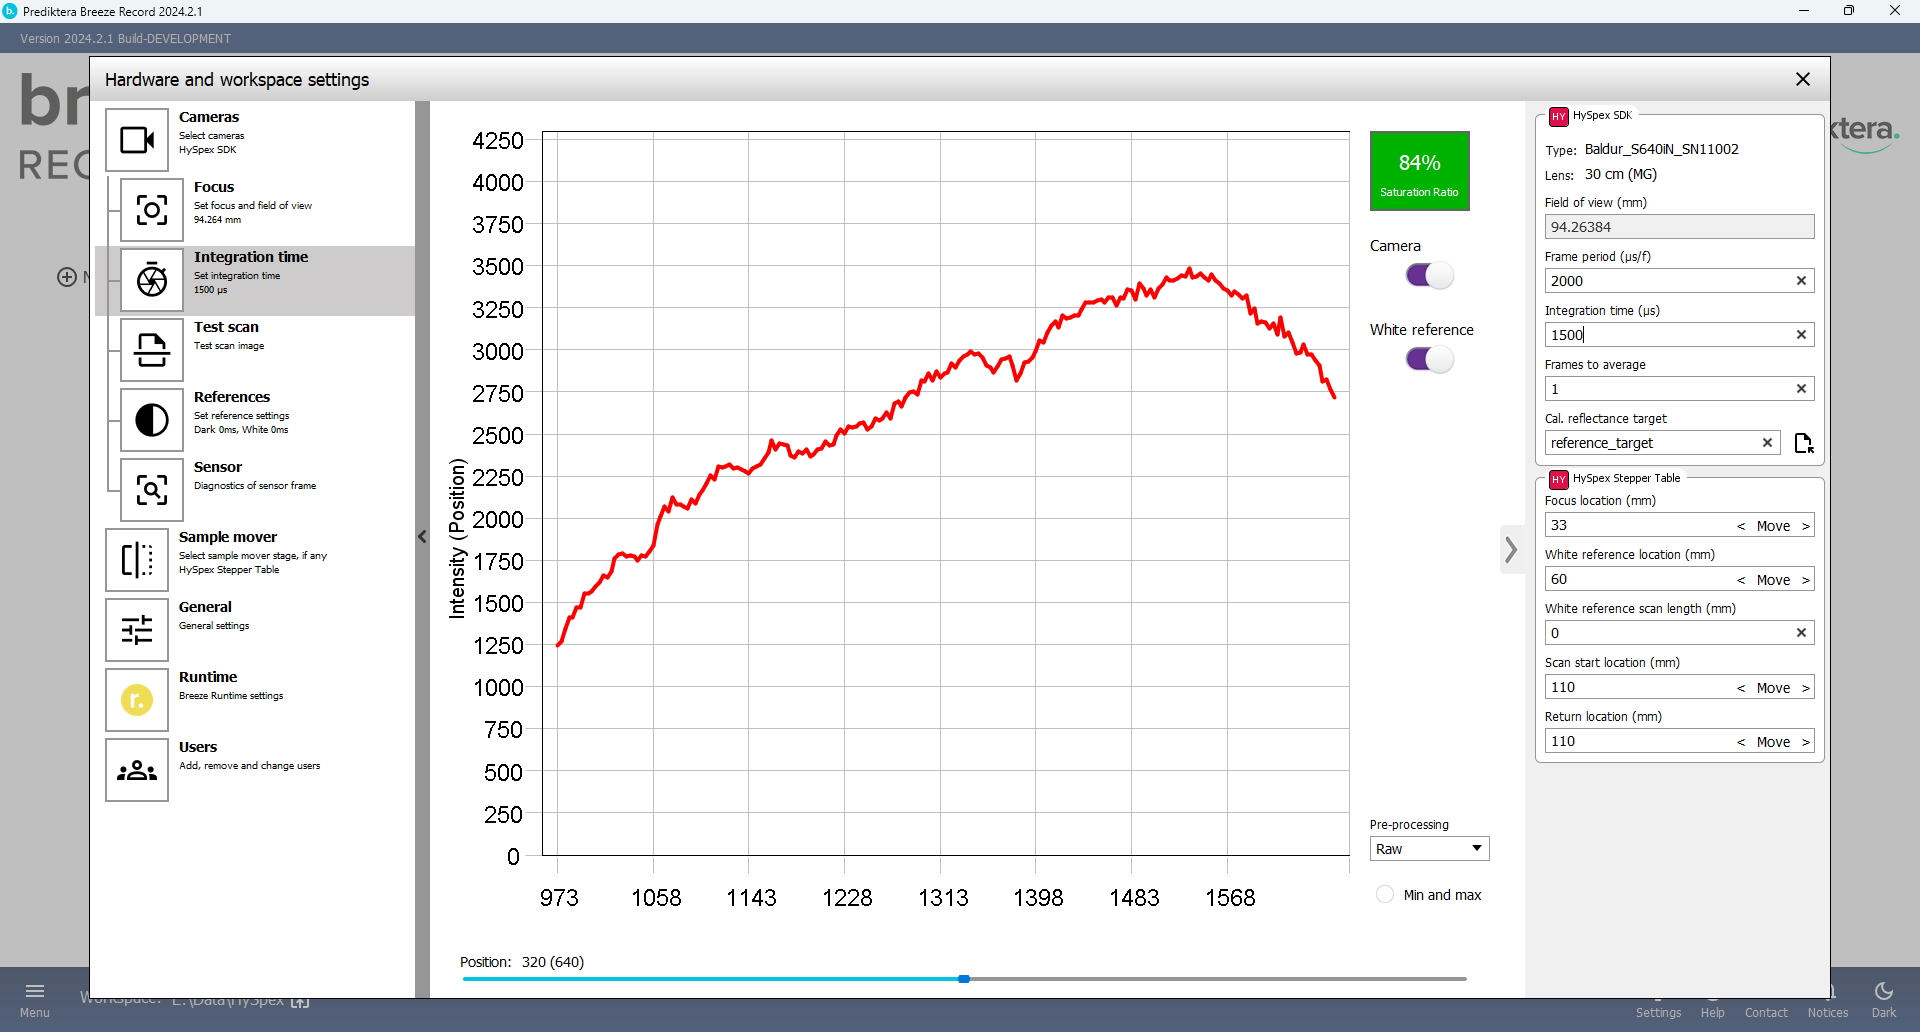
You can move “Position” slider to show white reference values on other pixels
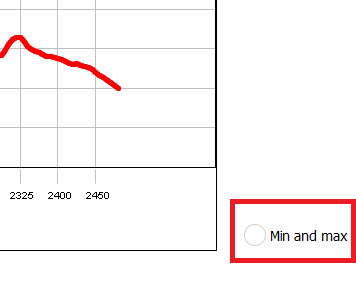
Press “Min and max” to show minimum and maximum overall pixels
If “Integration Time” is set to high the white reference image will be saturated, which means that some signal data can be lost.
Test scan
Press the “Test scan” button. Here you do a test image of your samples that will not be saved on the hard drive. This is done to make sure your camera settings are providing good results.
Set “Measurement Length”
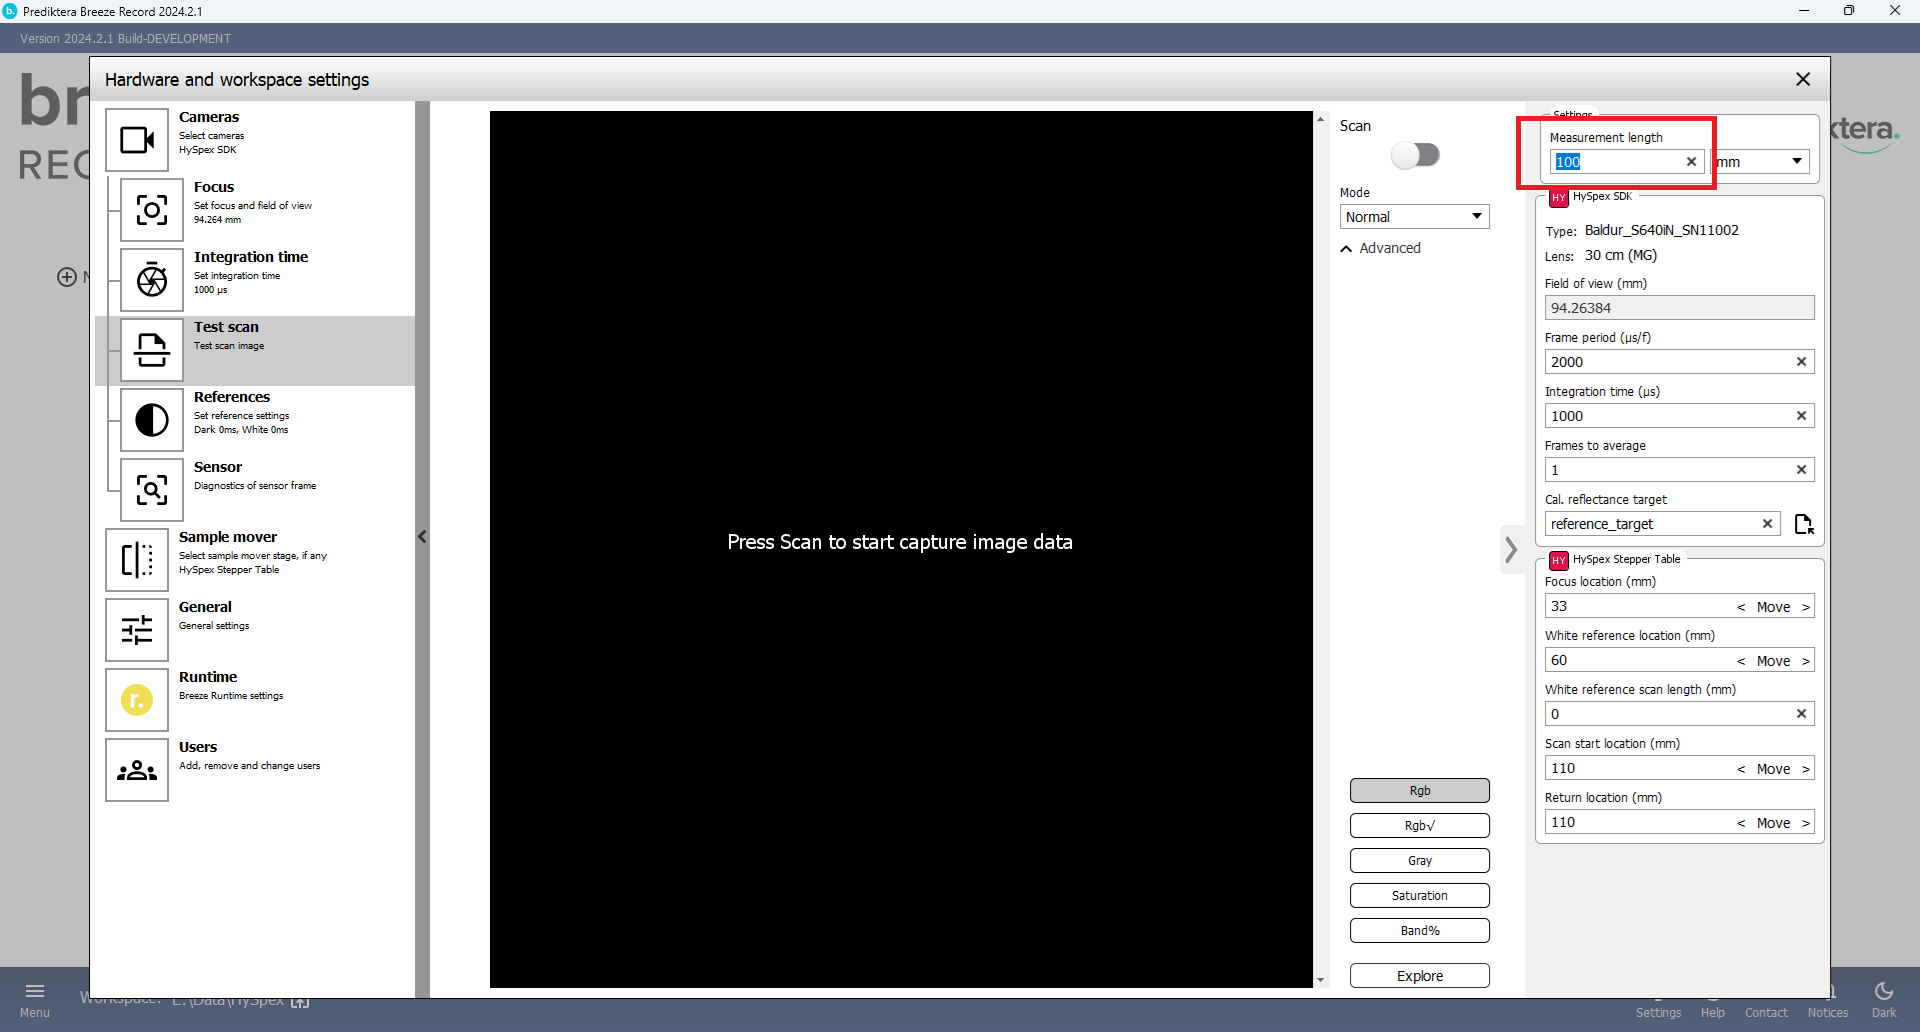
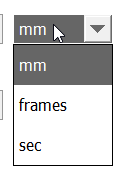
This is how long the image scan will be in millimeters, cm, frames or seconds.
Press “Scan” to start data acquisition of your samples.

There are buttons to select different visualization of your test set. Press the Intensity button to view the signal intensity of your image. White areas indicate over saturated pictures.
References
Press References button on the left side panel.
In the “Number of frames” field write how many frames will be captured when taking the references.
The “White Reference scan length” is how many mm it will scan when taking the white reference.

Breeze can to either capture new references with every new scan, or used stored references for a set time. In the “Select the reference capture mode” for the white and dark references you can select this. When selecting the “Used stored” option you can then select the time that the references are stored in the two input fields. When the time specified has expired Breeze will automatically take new references. If the values are 0 (default), it will take a new white and dark reference for every new scan.
For dark reference we recommend taking a new dark reference for every scan.
For the White reference you can select “Disabled”. This means it will not capture a separate white reference.
Example below, the white reference will be stored for two hours before it will take a new reference.
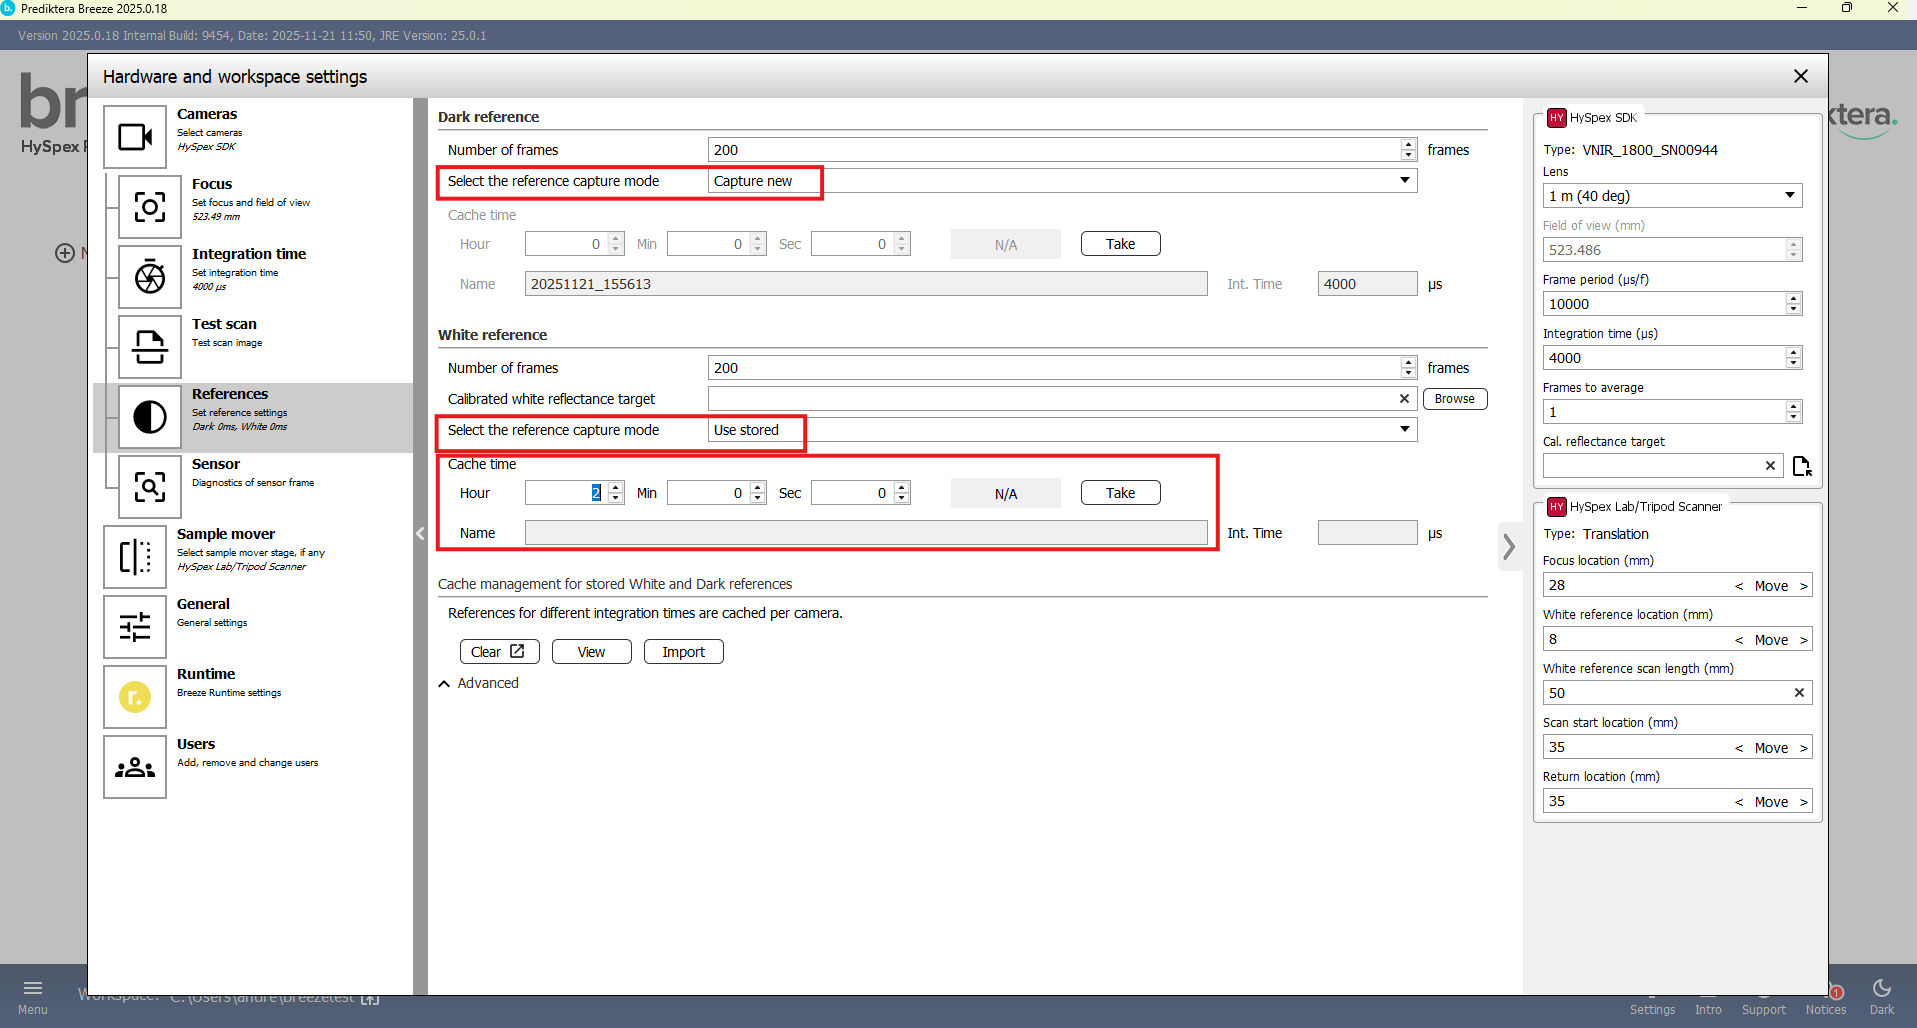
Learn more in Dark and White References.
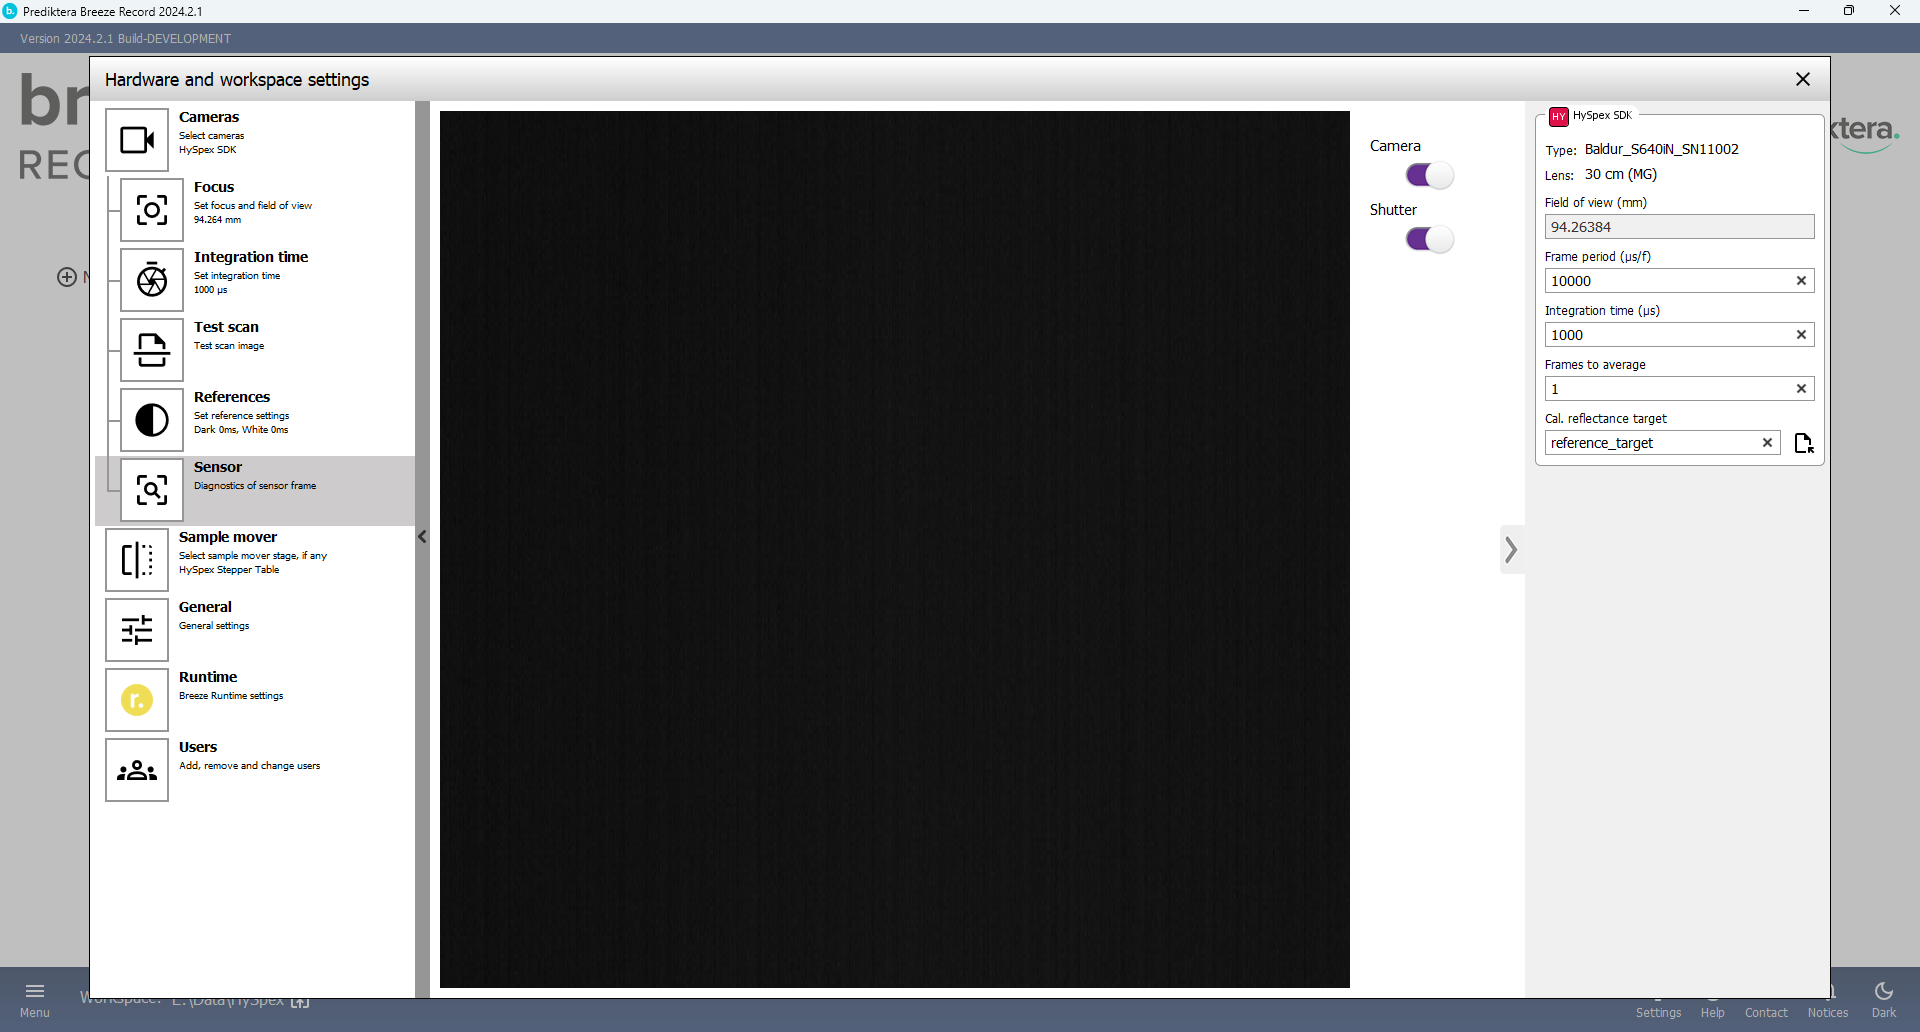
Sensor
The Sensor tab can be used for technical testing of the sensor in a camera, to identify bad or dead pixels.
Turn on the Camera switch to start capturing image data from the sensor.
Use the Shutter switch to close the shutter, if the camera has an automatic shutter.
When the shutter is closed, the image should be uniform if all sensor pixels are nominal. Vertical bands indicate bad pixels.
You have now completed the camera and sample mover setup.
Record an image and check the spectral data
Start Breeze and click on the “New Project” button on the left hand side.
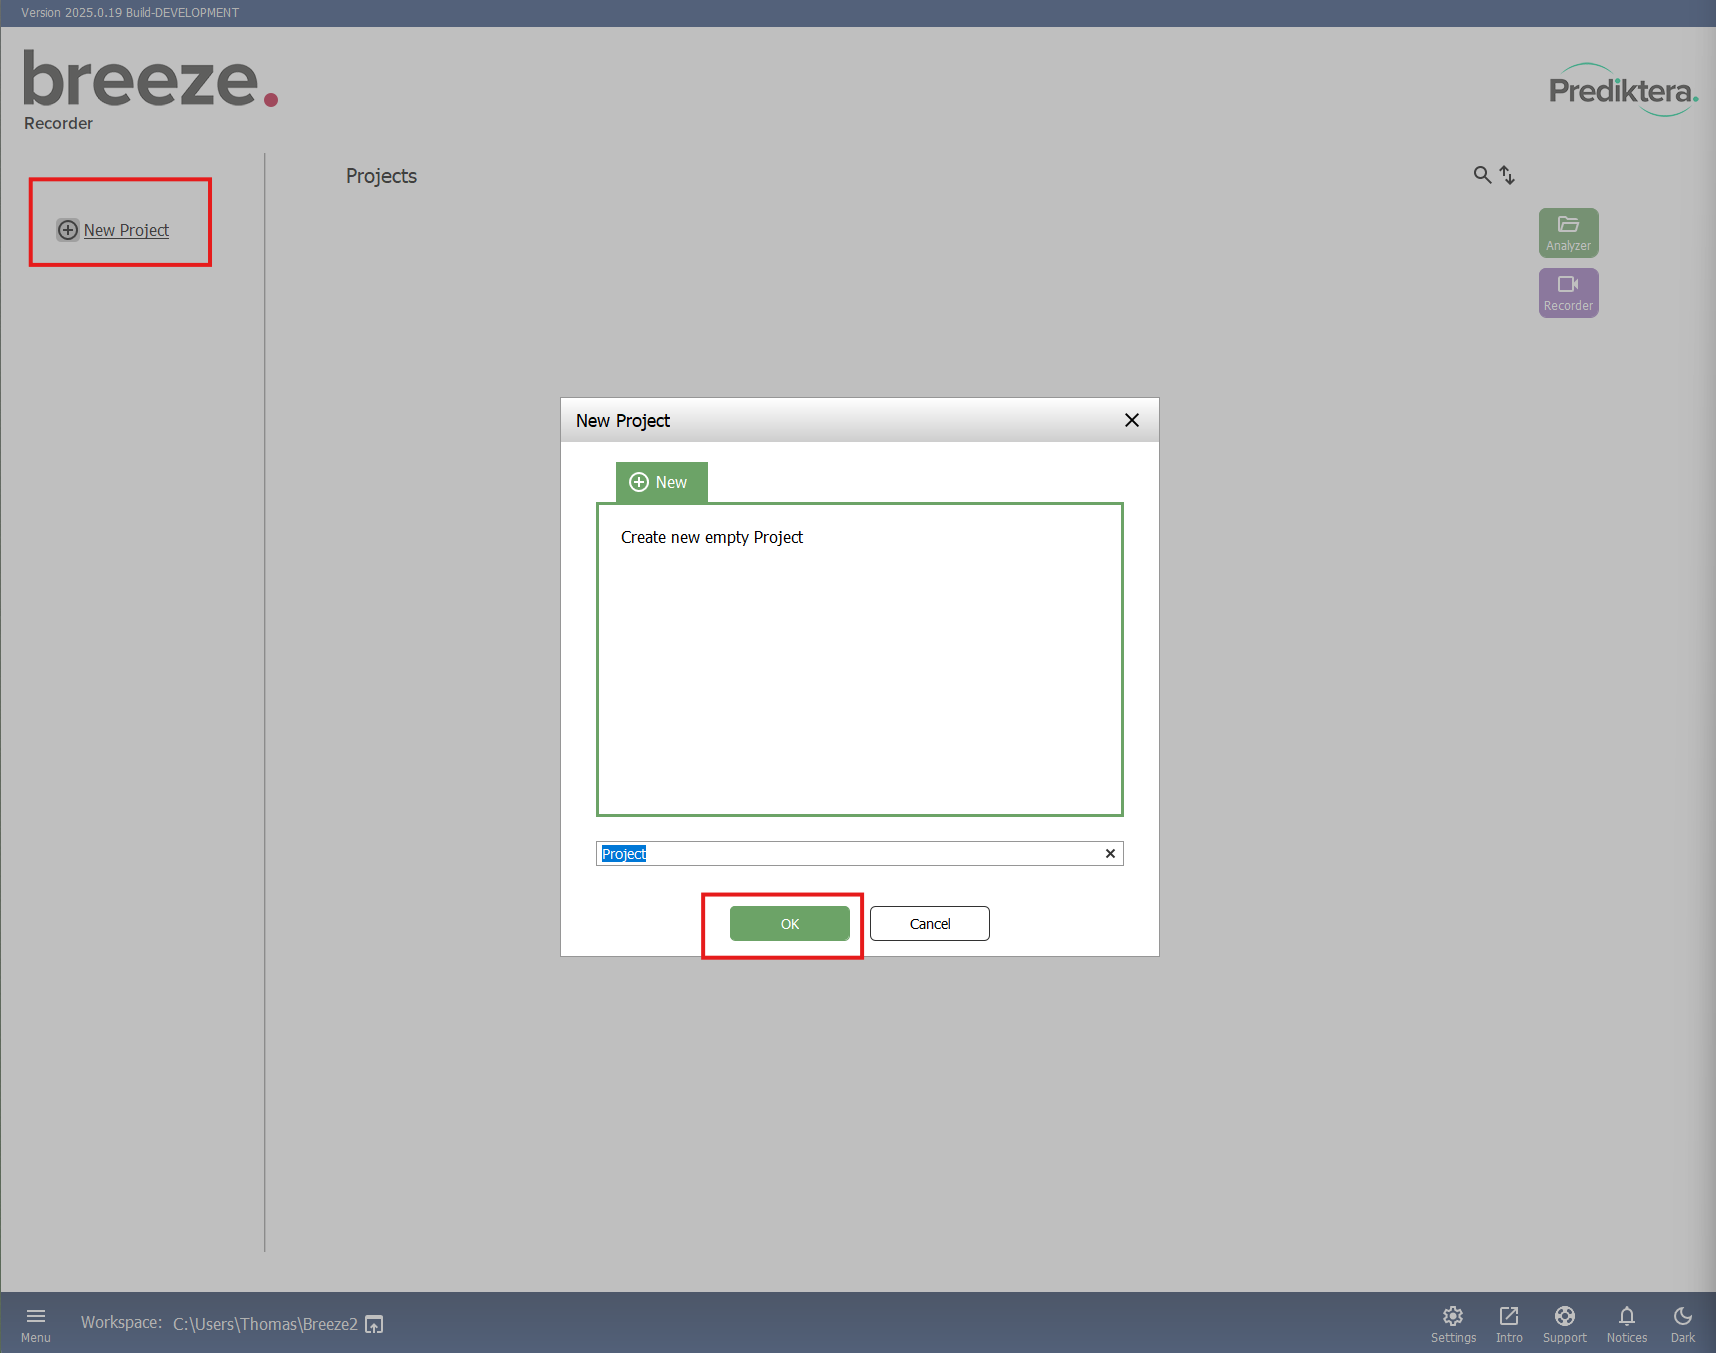
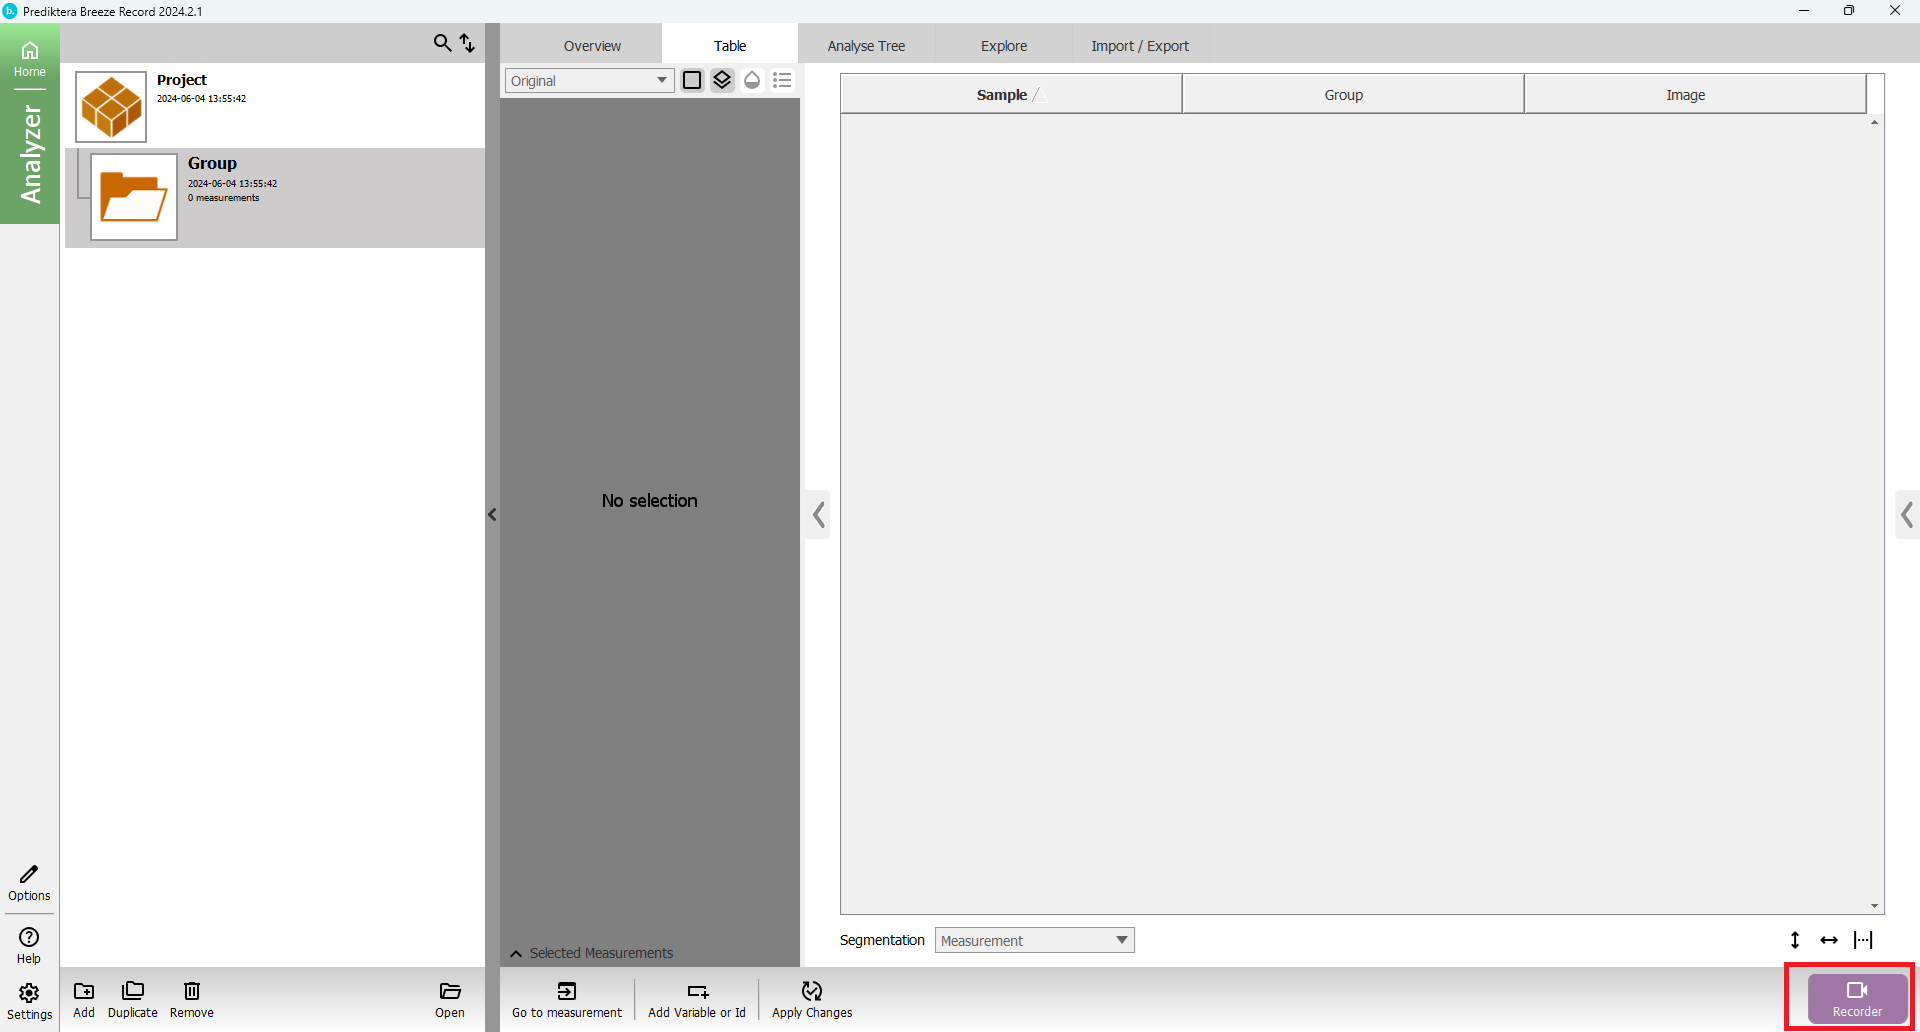
Open Breeze Recorder using the “Recorder” button.
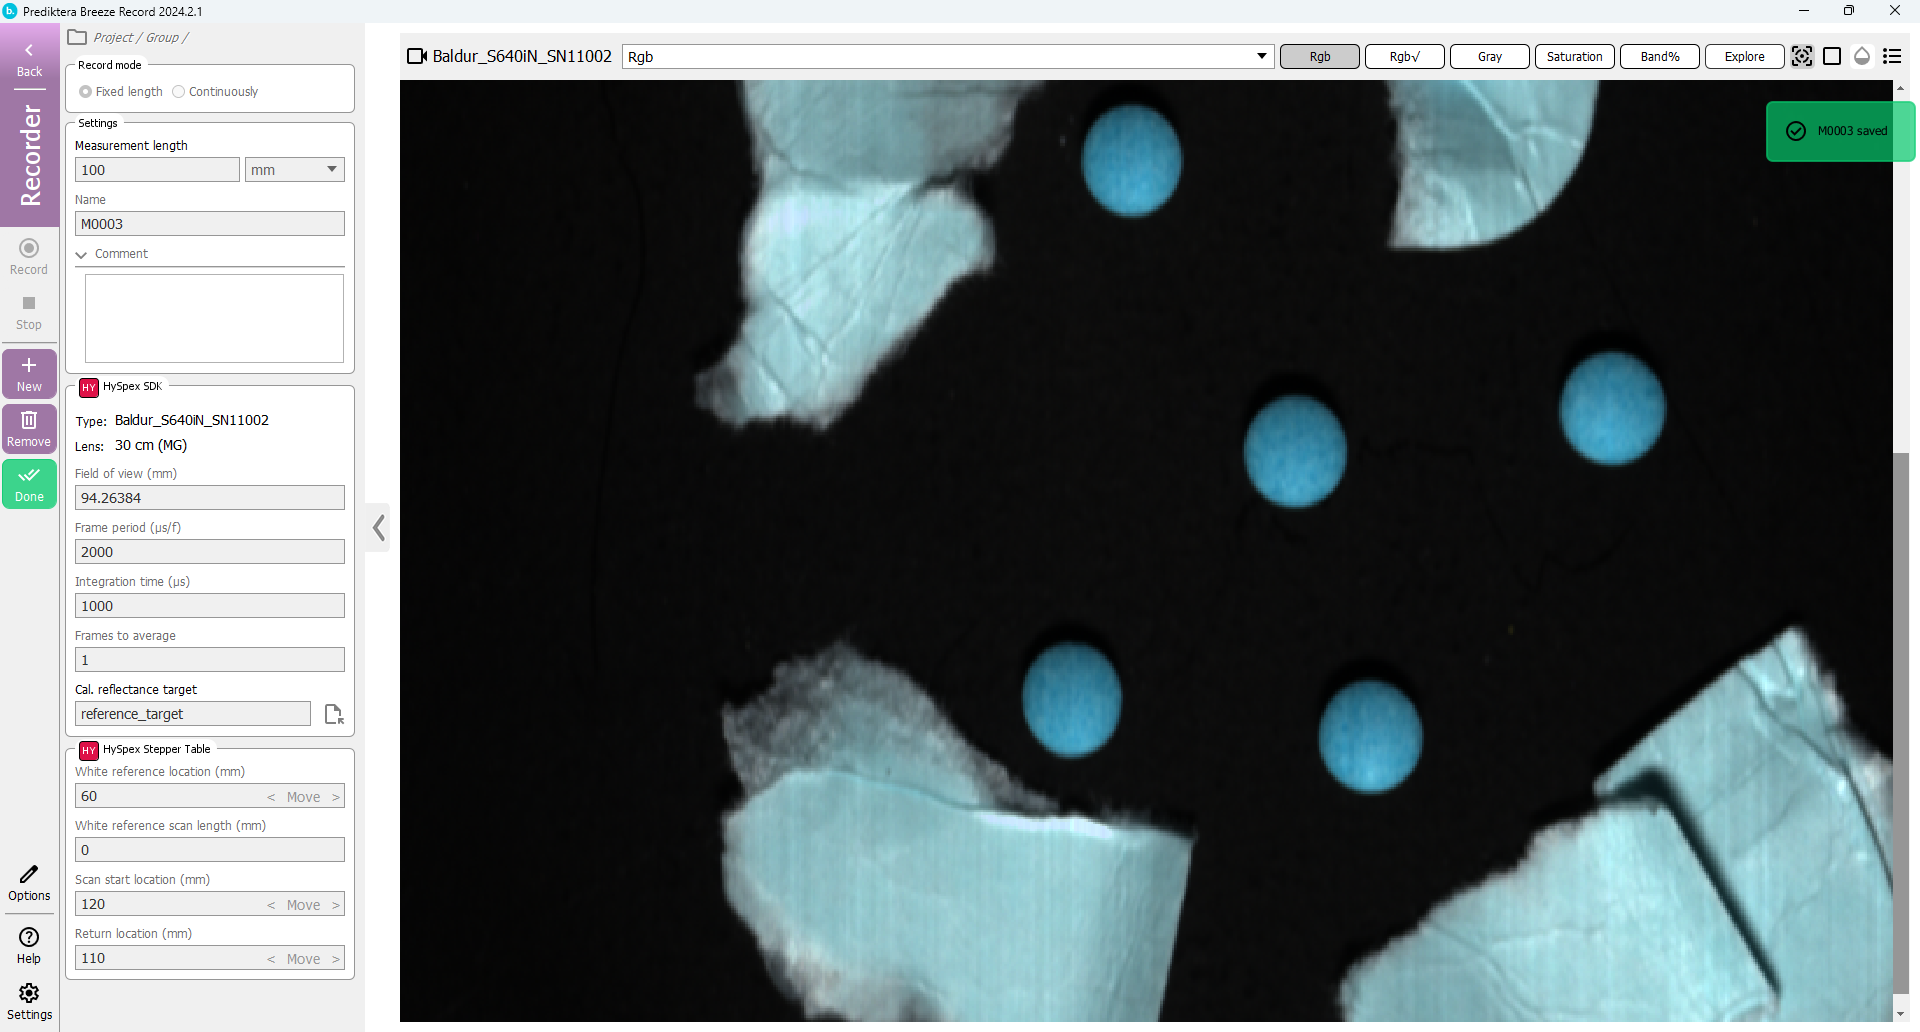
Your are now in the data aquisition view
On the left side you have a panel to enter information and adjust the settings that will be used for recording a new image. You will see the cameras and scanners that Breeze Recorder is connected to.
Set Measurement length (how long the scan will be)
Write your file name (optional: add comments that will be save as meta info with the image file)
Reference information: Configure if you want take an automatic white reference or not (“Disable”).
Adjust camera and scanner settings that you want to use for frame period and integration time.

Press the red Record button on the upper left side of the screen to start the data acquisition.
The dark reference will be taken first and again at the end after the image has been captured.
If you have configured to capture a new white reference, the table will move to your set white reference location and take the white reference.
The image will then be taken and stored.
Dark and white references will be taken for each recording.
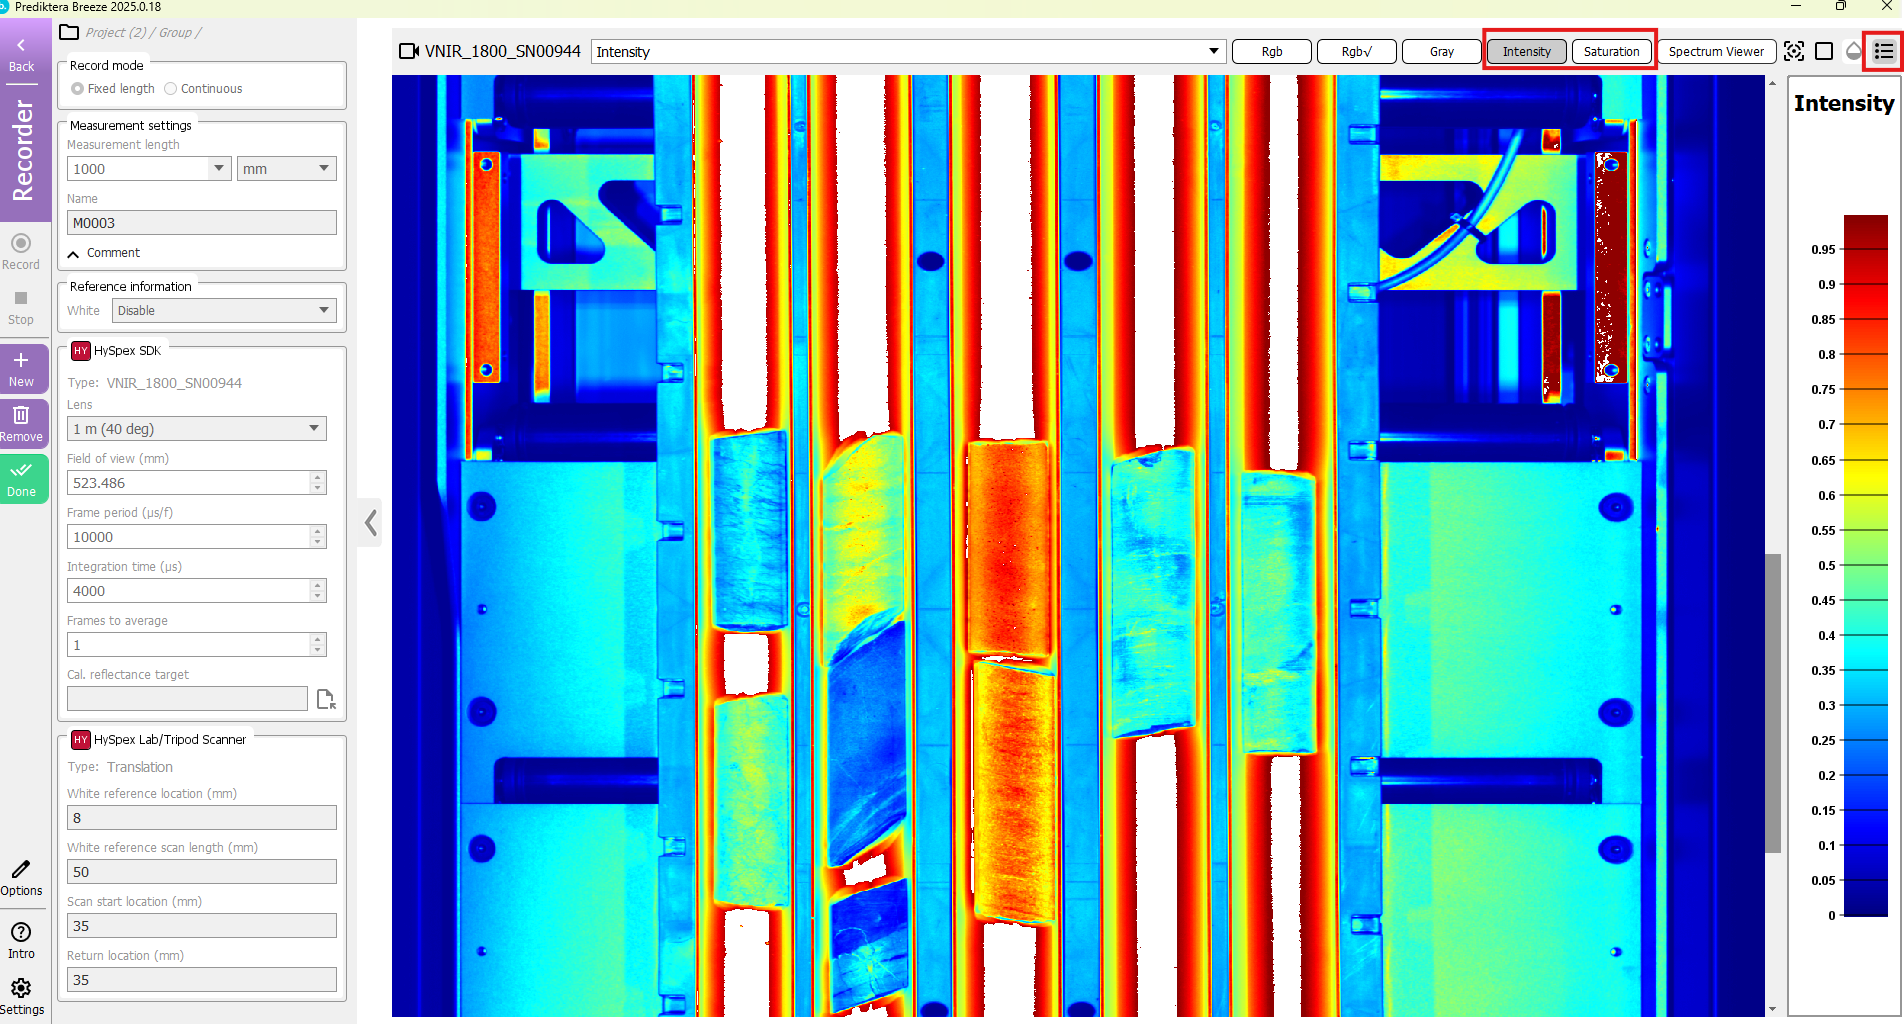
The default view is a pseudo RGB image
Change to “Intensity” to identify oversaturated areas (white color). The “Saturation” image will show the % of bands that are saturated.
Tip If you have saturated pixels on your samples: lower integration and record the image again.
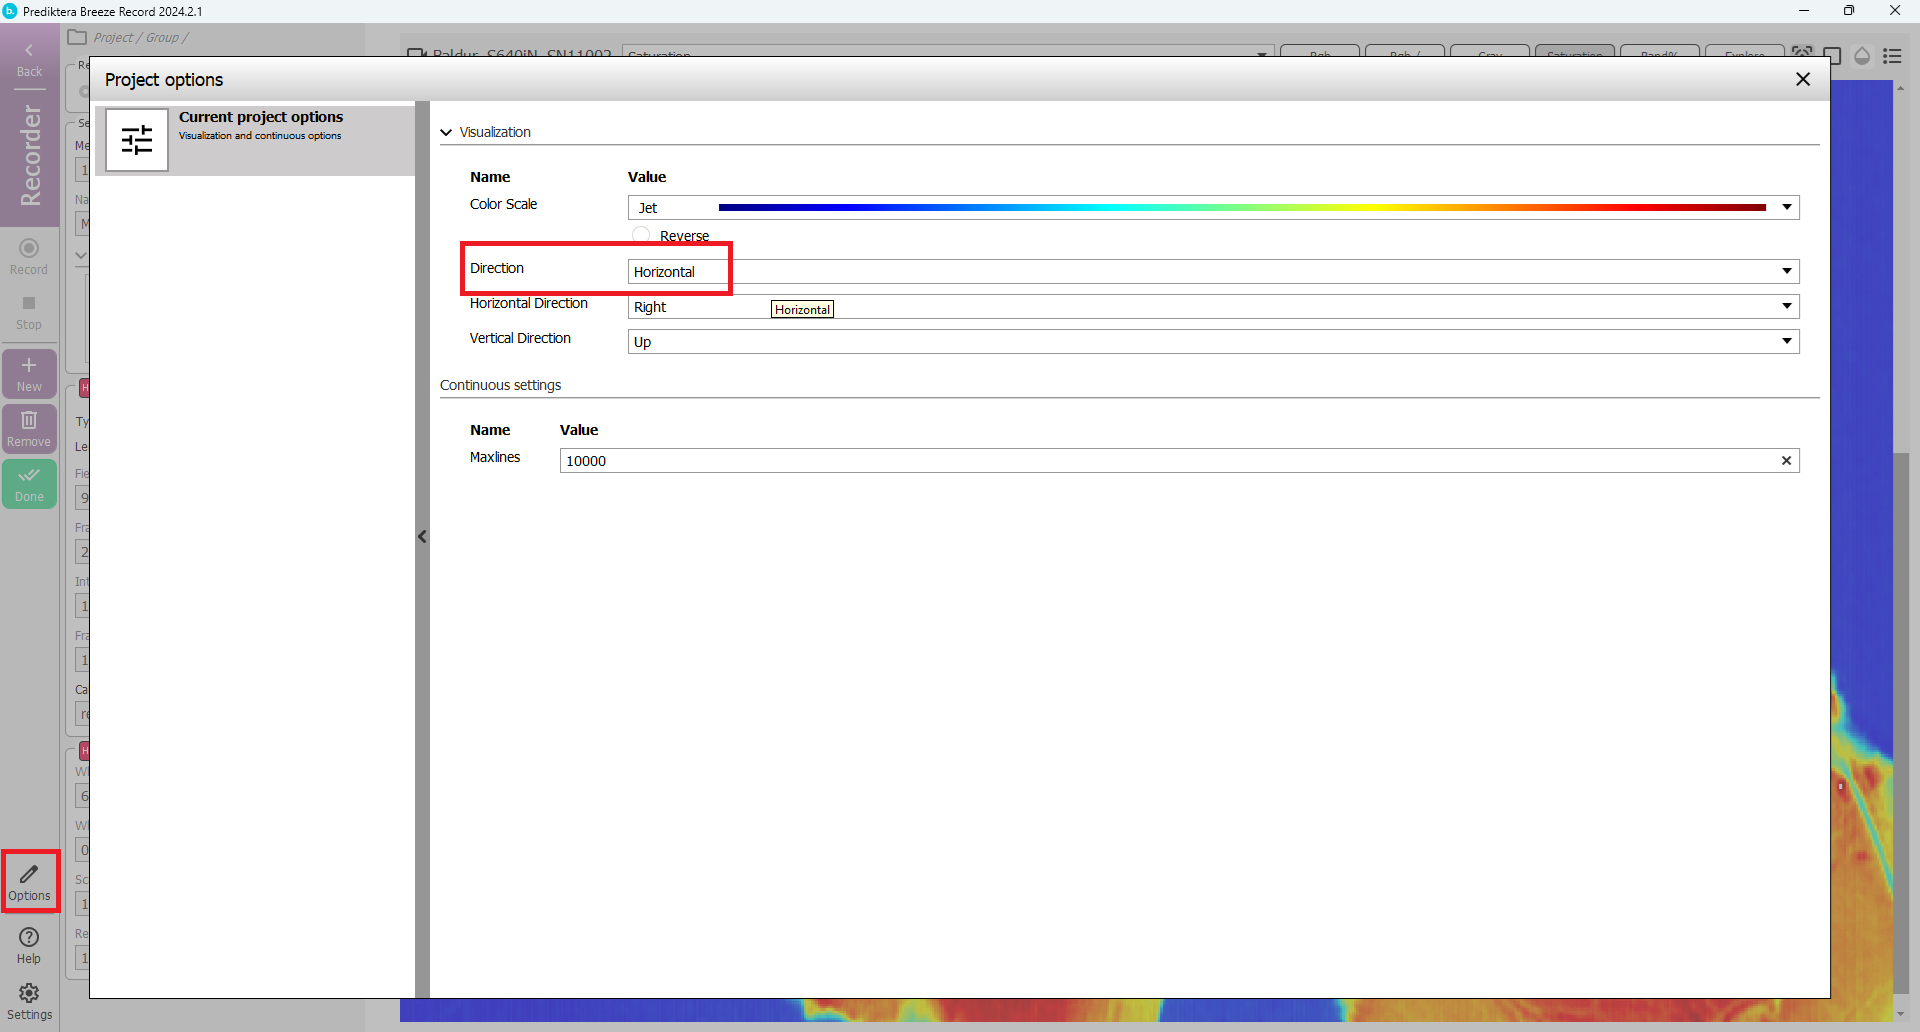
Option: You can change direction of the visualization from vertical to horizontal scanning with the Options button / settings / Visualization
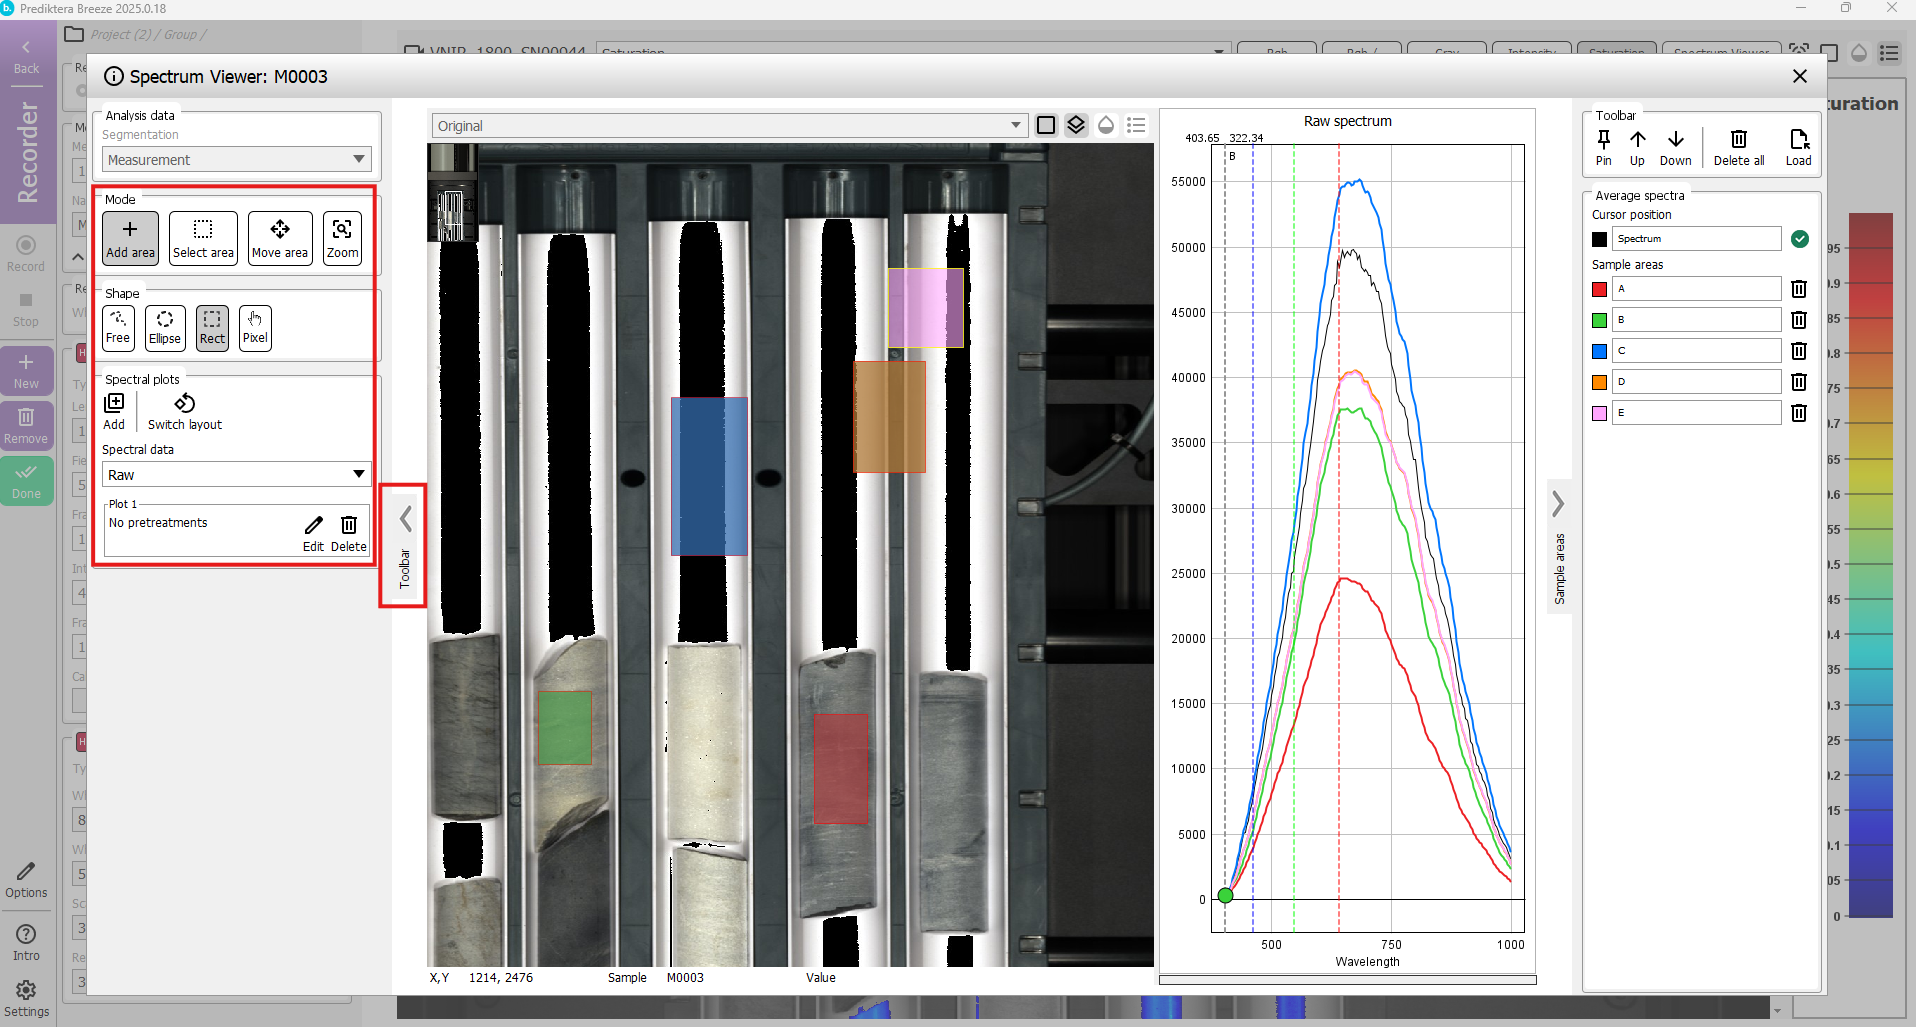
Press “Spectrum viewer” button to view the captured image spectra
If you move the mouse cursor around in the pseudor RGB image it will update the spectral plot and show the spectrum for each pixel. If you hold down left mouse button you can select areas and view and compare the average spectrum for each area.
On the left side of the screen there is a tool bar with tools for selecting areas and adding spectral plots.
You can also select to view the spectra as raw spectra or converted to radiance, reflectance and absorbance (if there is a white ref).
If you are happy with your captured image you can then close the spectrum viewer and then
Press “New” button to record another image (the previous image has already been saved)

Press “Remove” button to delete the current measurement (if you do not want to keep it)

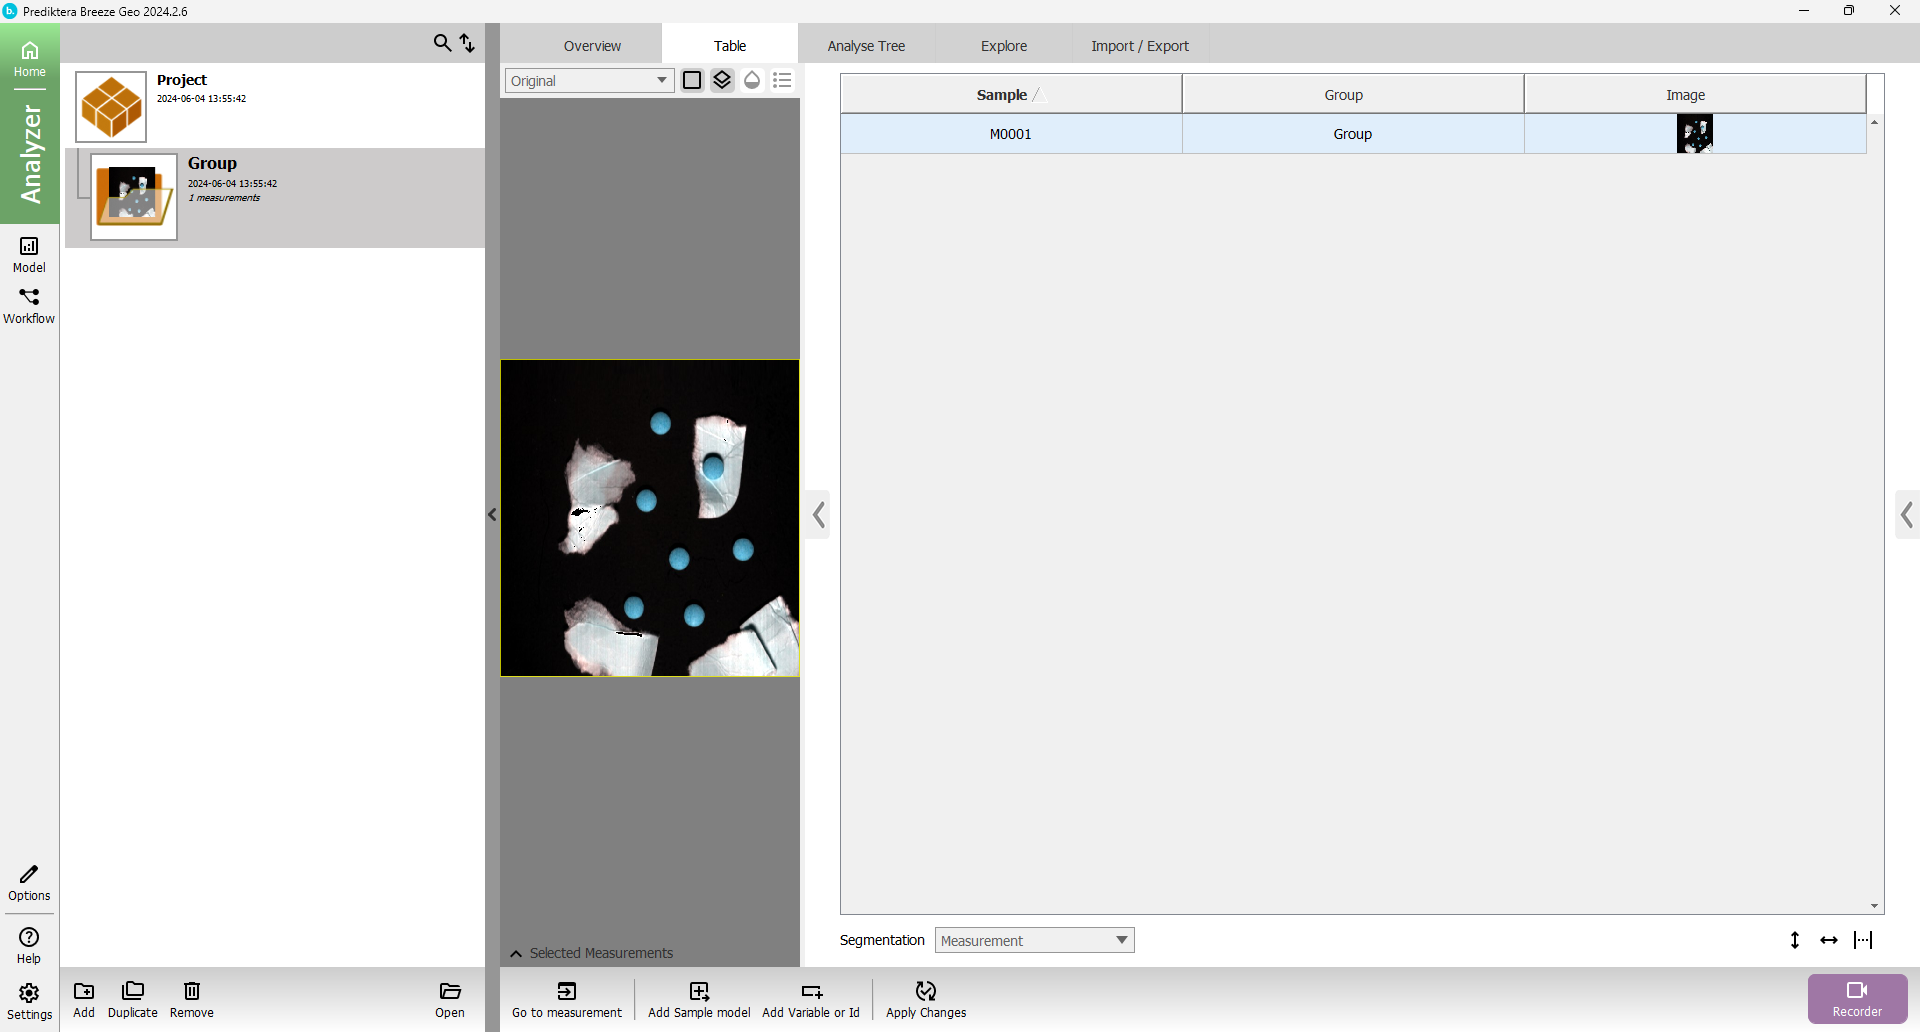
Press “Done” to leave the data caturing view and go to the Analyser view
Here you can see all the images you have recorded in your project.

note The recorded images are located on disk under the workspace folder:
{workspace folder}\Record\{project name}\{group name}

You can have make several workspaces and switch between them depending on where you want to store our data.
Right click on the measurement select “Open in File Browser” to access the file
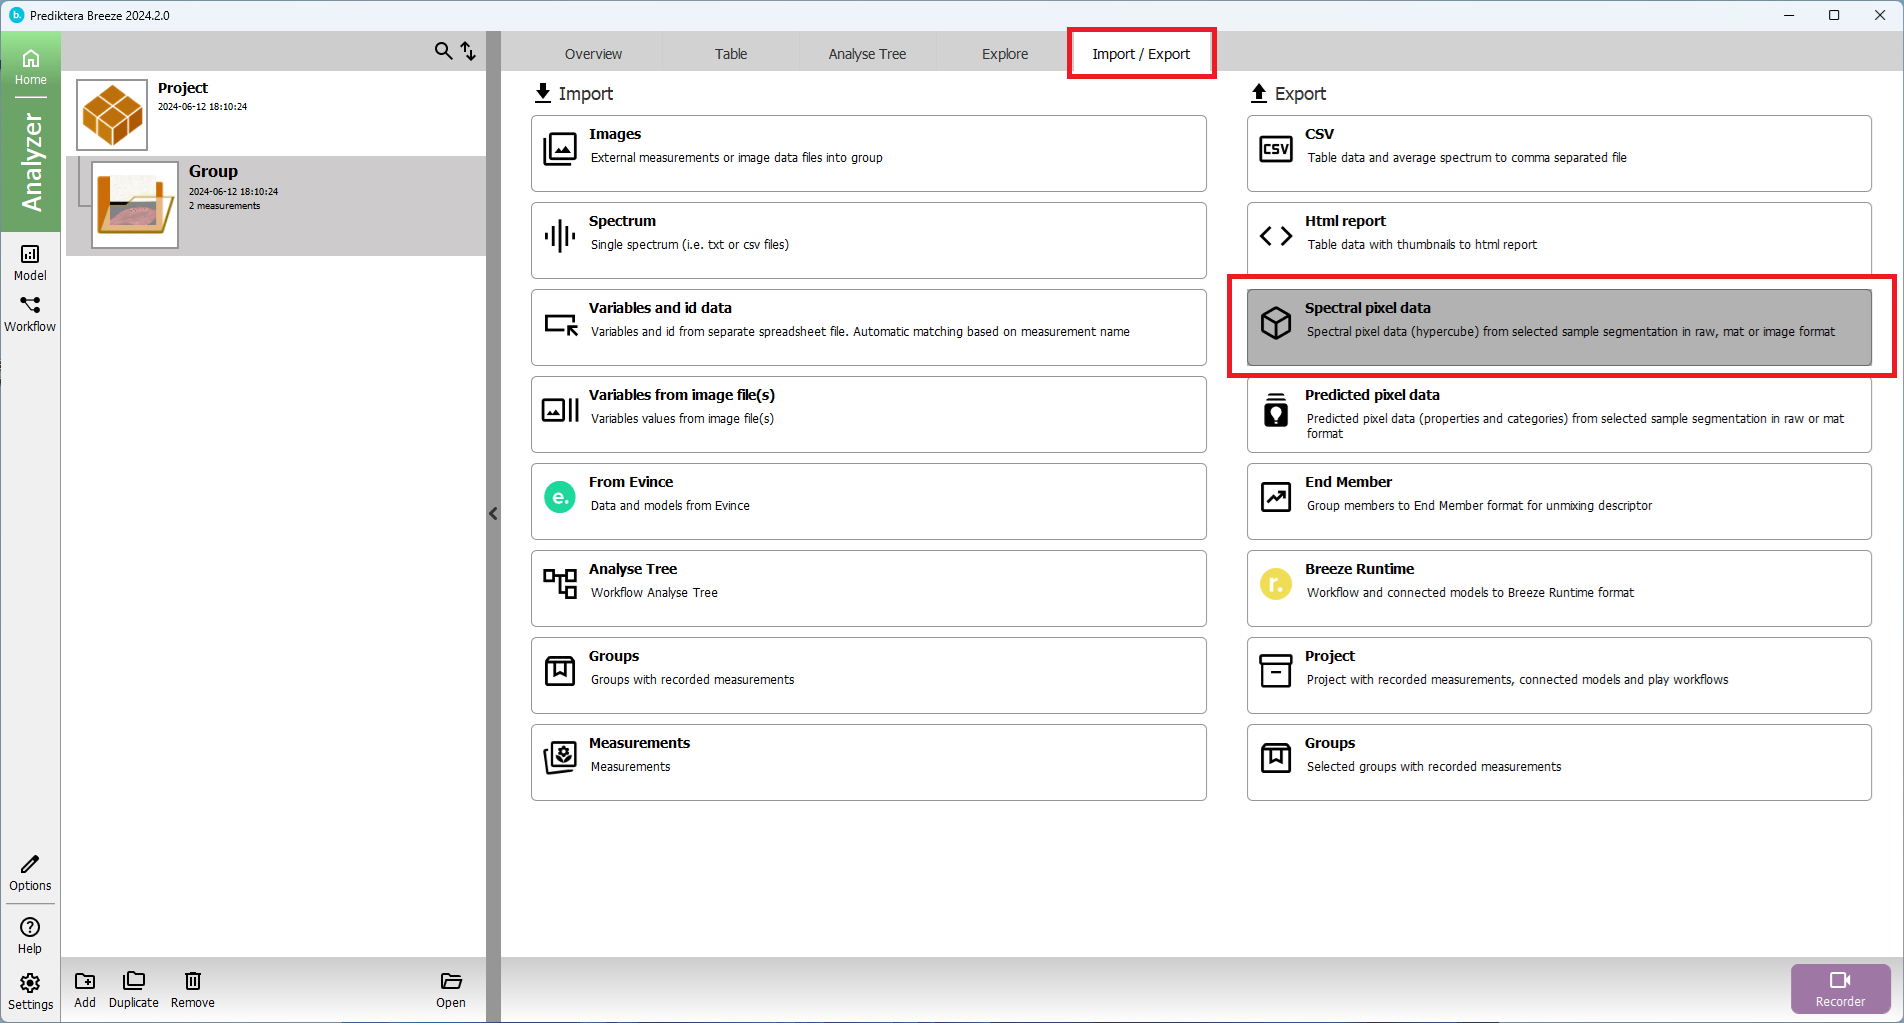
or choose Export “Spectral pixel data” to export raw, reflectance or absorbance
You can export your work by pressing the “Import/Export” button. Then press the spectral pixel data to get the spectral pixel data (hypercube) from the selected sample segmentation in Raw, Mat or image format.
Great job completing the Breeze Recorder Guide! We hope you've enjoyed using our Breeze Recorder software.